
Figures & data
Figure 1. Unsupervised cluster analysis A, Cophenetic coefficient for selecting the optimal NMF rank in cluster analysis; B, heat map of the two molecular subtypes using the 53 ferroptosis-related genes (FRGs).
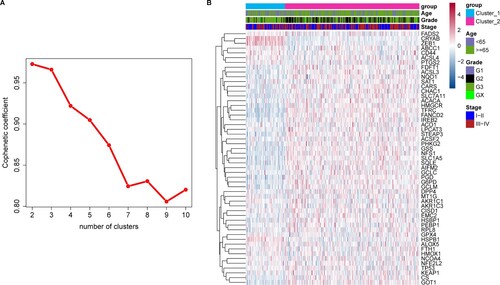
Figure 2. Correlation between clinical factors and gastric adenocarcinoma (GAC) subtypes. Clinical factors included AJCC tumor grade, age, sex, overall survival (OS) time, and status. The x-axis represents different groups (subtypes) and the y-axis different values for each clinical factor.
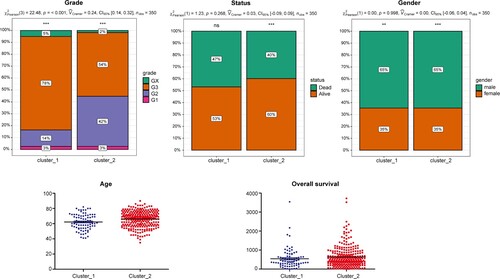
Figure 3. Heat map of gene set enrichment analysis (GSVA). The different colors in the top bar represent different gastric adenocarcinoma (GAC) subtypes.
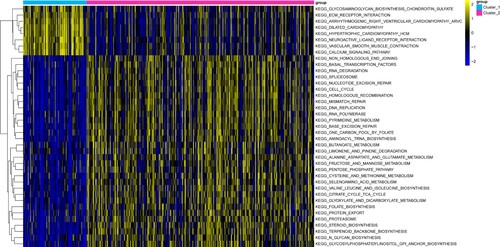
Figure 4. Immune infiltration analysis in two gastric adenocarcinoma (GAC) subtypes. The x-axis represents different immune cells selected based on previous literature and the y-axis represents the different levels of immune infiltration. Different colors represent different gastric adenocarcinoma (GAC) subtypes.
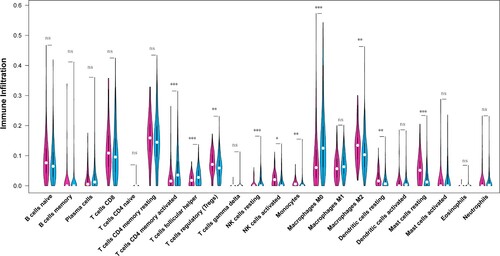
Figure 5. Investigation of differentially expressed genes (DEGs) between two gastric adenocarcinoma (GAC) subtypes. A, Top20 results of enrichment analysis for differentially expressed genes (DEGs) between the two subtypes. The x-axis represents the P value and the y-axis the different functions or pathways enriched by DEGs. P < 0.05 was selected as the cutoff value for this enrichment analysis. B, Heat map for the Top100 upregulated genes and the Top100 downregulated genes between two gastric adenocarcinoma (GAC) subtypes.
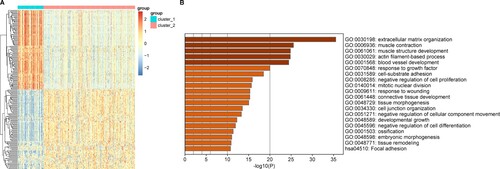
Figure 6. LASSO regression and Kaplan-Meier (K-M) survival analysis for prognostic feature genes of gastric adenocarcinoma (GAC) subtypes. A, LASSO regression analysis showed 12 feature genes. The x-axis represents the value of log(λ) and the y-axis the value of partial likelihood deviance. B, Survival analysis of the two subgroups stratified based on the median risk scores. C, Validation of the prognostic risk feature genes. The x-axis represents survival time (days) and the y-axis survival probability. The red line represents the high-risk group and the blue line the low-risk group.
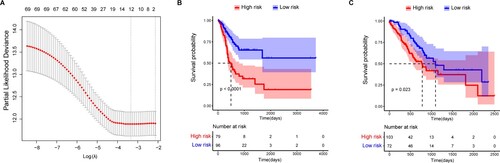
Table 1. Univariate Cox regression analysis based on risk score and clinical characteristics of GAC
Table 2. Multivariate Cox regression analysis based on risk score and clinical characteristics of GAC.
Data availability statement
The RNAseq data and clinical phenotype data of stomach adenocarcinoma (STAD) analyzed in this study is available publicly from The Cancer Genome Atlas (TCGA) database at https://xenabrowser.net/.