
Figures & data
Figure 1. Map of the study sites of Holetta (Welmera Woreda) and Ada-Berga (Ada-Berga Woreda) in Ethiopia.
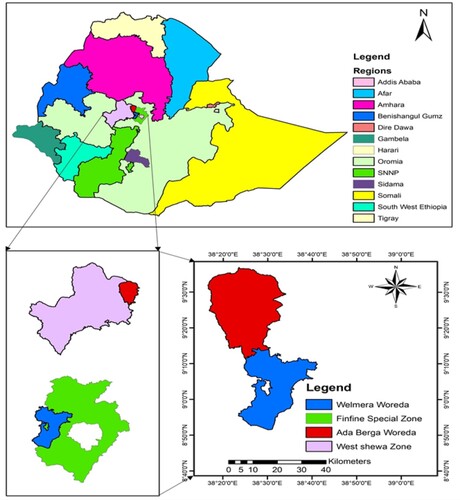
Table 1. List of studied agro-morphological traits and their descriptions.
Table 2. Combined analysis of variance (ANOVA) and expected mean squares for the random model of RCBD design.
Table 3. Mean squares from a combined ANOVA for 24 traits of 120 oat genotypes grown at Holetta and Ada-Berga in 2020/21 cropping season.
Table 4. Mean performance for 24 traits of 120 oat genotypes grown at Holetta and Ada-Berga in 2020/21 cropping season.
Table 5. Mean comparison of the top 5% forage and seed yielder genotypes with the least yielder 5% genotypes, mean of population and mean of released varieties for 24 traits of oat grown at Holetta and Ada-Berga in 2020/21 cropping season.
Table 6. Mean performance of the top 5% forage and seed yielder genotypes for 24 traits of oat grown at Holetta and Ada-Berga in 2020/21 cropping season.
Table 7. Components of variance and coefficient of variation for 24 traits of 120 oat genotypes grown at Holetta and Ada-Berga in 2020/21 cropping season.
Table 8. Heritability, genetic advance, and genetic advance as percent of mean for 24 traits of 120 oat genotypes grown at Holetta and Ada-Berga in 2020/21 cropping season.
Data availability statement
The data supporting the findings of this study are in the figshare repository and can be accessed using the link: http://www.doi.org/10.6084/m9.figshare.21828840.