
Figures & data
Table 1. Patient characteristics.
Figure 1. Identification of DEGs: (A) Hierarchical clustering analysis of top 100 DEGs between HT and controls; (B) Hierarchical clustering analysis of top 100 DEGs between HCH and controls; (C) Hierarchical clustering analysis of top 100 DEGs between HT and HCH; row and column represented DEGs and samples, respectively. The color scale represented the expression levels. (D) Venn diagram of up-regulated DEGs in HT and HCH. (E) Venn diagram of down-regulated DEGs in HT and HCH. Purple represented DEGs between HT and controls; yellow represented DEGs between HCH and controls; green represented DEGs between HT and HCH.
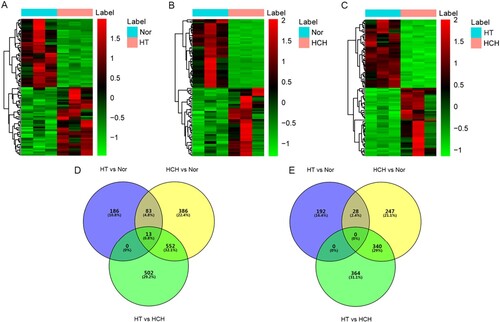
Table 2. Top 10 up- and down-regulated HT-specific DEGs.
Table 3. Top 10 up- and down-regulated HCH-specific DEGs.
Figure 2. HT-specific PPI networks. Each node represents a protein, while each edge represents one protein–protein association.
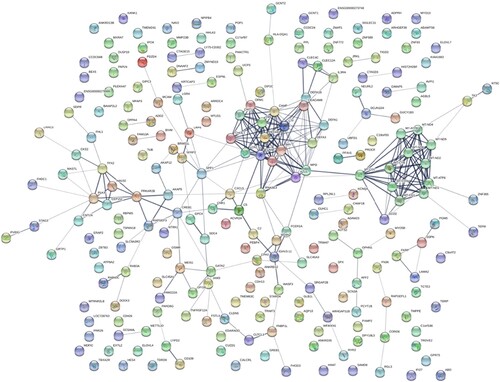
Figure 3. HCH-specific PPI networks. Each node represents a protein, while each edge represents one protein–protein association.
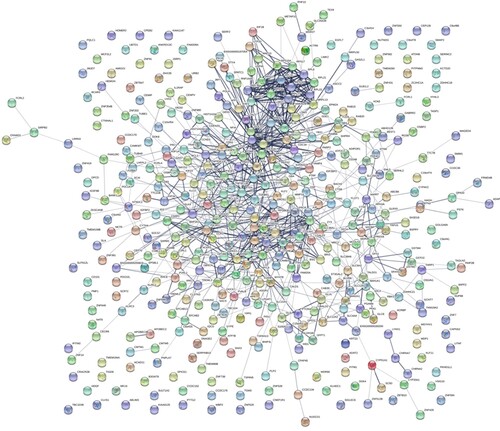
Figure 4. Immune cell types that differed significantly among HT, HCH control groups: (A) Monocyte, (B) Natural killer cell, (C) Regulatory T cell, (D) Type 2 T helper cell, (E) Type 17 T helper cell. * indicates p < 0.05, ** indicates p < 0.01, ns indicates not significant.
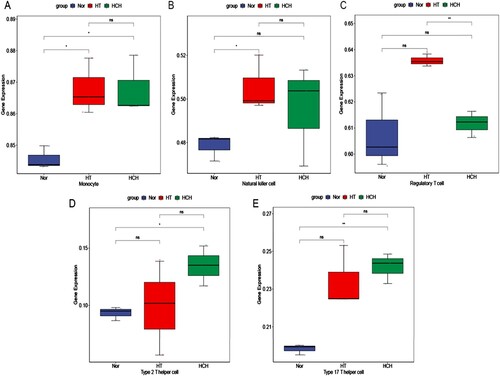
Figure 5. The RT-qPCR results of DEGs in human subjects. * indicates p < 0.05, ns indicates not significant.
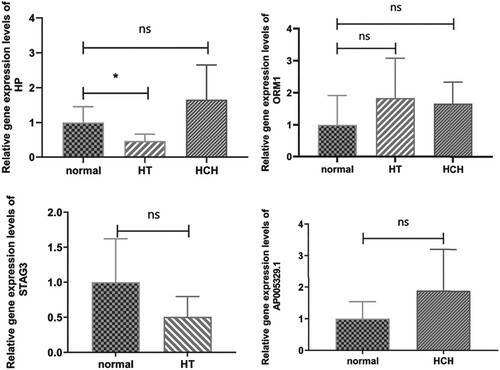
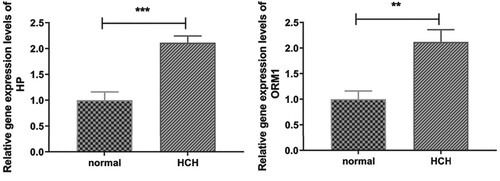
Figure 6. The RT-qPCR results of DEGs in cell model. ** indicates p < 0.01, *** indicates p < 0.001.
Supplemental Figures and Tables
Download MS Word (13.7 MB)Data availability statement
The RNA-seq data has been deposited in the BioProject database (BioProject ID: PRJNA941949, https://www.ncbi.nlm.nih.gov/bioproject/941949). The raw data of RT-qPCR has been deposited in the Harvard Dataverse database (https://dataverse.harvard.edu/dataset.xhtml?persistentId = doi:10.7910/DVN/N1CH3Y).