Figures & data
Fig. 1 Overview of the substudies presented within this article.
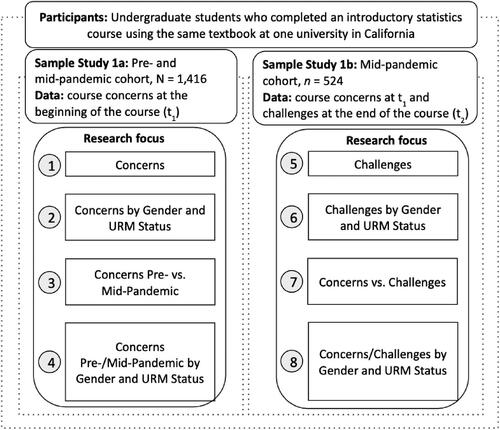
Table 1 Demographic characteristics of participants in both samples.
Table 2 Frequency (in %) of reported concerns overall and broken down by pre-/mid-COVID cohorts, gender, and URM (Study 1b, n 1417).
Table 3 Concerns (in %) by gender/URM and by pre-/mid-COVID cohort (Study 1a, n = 1417).
Table 4 Frequency (in %) of mentioned concerns and perceived challenges for the subsample of students (Study 1b, ).
Table 5 Frequency (in number and %) of mentioned concerns and perceived challenges based on Consistency Indicator (Study 1b, n = 524. Note: includes only students who provided responses for both open-ended questions).
Table 6 Frequency of mentioned concerns and perceived challenges based on Consistency Indicator by Gender and URM (Study 1b, n = 524. Note: includes only students who provided responses for both open-ended questions).