Figures & data
Fig. 1 Logistic curve modeling the relationship between pupil dilation and sexual orientation. Points are colored by sex of the subjects (blue for male and red for female).
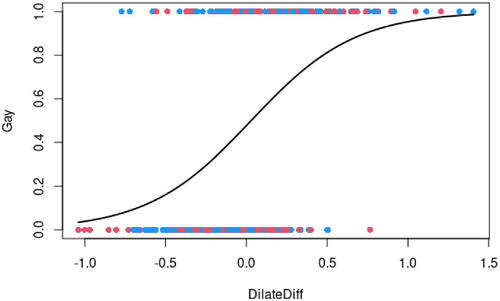
Fig. 2 Causal diagram for the relationships among Sex, Height, and Time to complete the Indoor Obstacle Course Test at West Point.
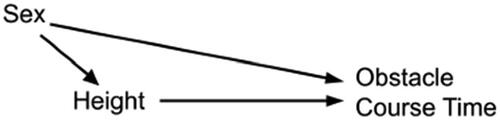
Fig. 3 Causal diagram for the relationships among the race of the victim, the race of the defendant, and whether or not the defendant was convicted.
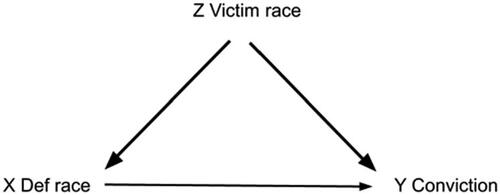
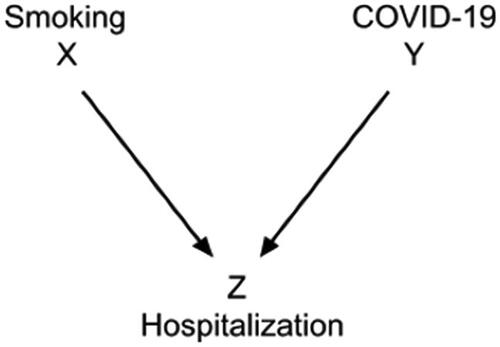
Fig. 4 Causal diagram (a collider) for the relationships among smoking status, COVID-19 status, and hospitalization.
Data Availability Statement
Data sharing is not applicable to this article as no new data were created or analyzed in this study.