Figures & data
Fig. 1 Example DAG. Here, there are three nodes representing three factors: cause, other cause, and effect. The arrows demonstrate the causal relationships between these factors such that cause causes effect and other cause causes both cause and effect.
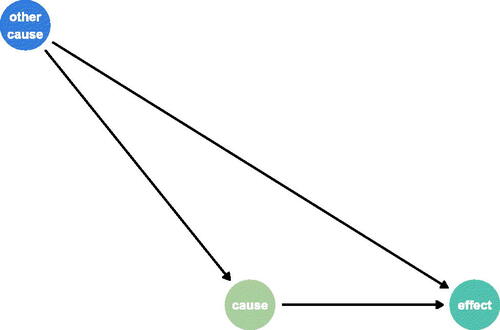
Fig. 2 Directed acyclic graphs describing the four data generating mechanisms: (1) Collider (2) Confounder (3) Mediator (4) M-Bias.
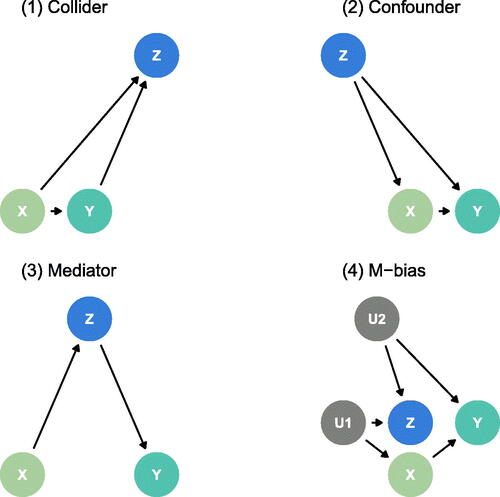
Table 1 Causal terminology along with the data generating mechanism for each of the four datasets included in the causal quartet.
Fig. 3 100 points generated using the data generating mechanisms specified (1) Collider (2) Confounder (3) Mediator (4) M-Bias. The blue line displays a linear regression fit estimating the relationship between X and Y; in each case, the slope is 1.
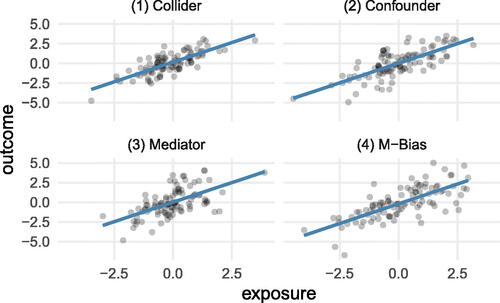
Table 2 Correct causal models and average causal effects for each data-generating mechanism.
Table 3 Estimated average treatment effects under each data generating mechanism with and without adjustment for Z as well as the correlation between X and Z.
Fig. 4 Time-ordered collider DAG (with time increasing from left to right) where each factor is measured twice. X is the exposure, Y is the outcome, and Z is the measured factor. The highlighted Z node indicates which time point is being adjusted for when estimating the average treatment effect of the highlighted X on the highlighted Y.
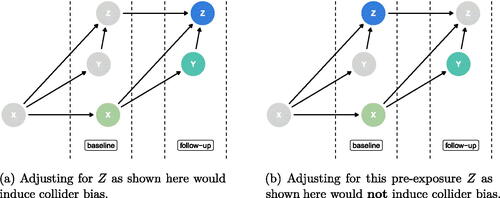
Table 4 Coefficients for the exposure under each data generating mechanism depending on the model fit as well as the correlation between X and Z.
appendix.pdf
Download PDF (17.9 KB)Data Availability Statement
The causal quartet datasets presented in this article are available in an R package titled quartets (D’Agostino McGowan Citation2023). https://r-causal.github.io/quartets/