Figures & data
Table 1 Examples of articles chosen in regression and time series analysis.
Table 2 The teaching objectives and Bloom’s Taxonomy.
Table 3 The procedure in the three lessons.
Table 4 Groups, reading tasks, and assigned questions.
Fig. 1 Frequencies of issues at the beginning and the end of the three lessons.
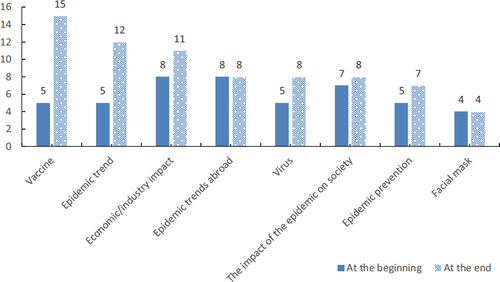
Fig. 2 Frequencies of the number of questions put forward by students at the beginning and the end of the three lessons.
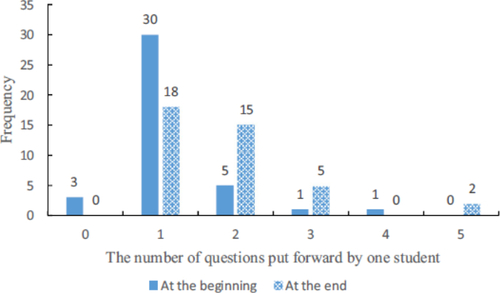
Table 5 The instructions and the percentage we took in the assessment process.
Supplemental material
supplements.zip
Download Zip (162.5 KB)Data Availability Statement
The data and the code in this article are available at https://github.com/zjwzajyl/teaching.