Figures & data

Table 1. Total P and Fe concentrations, molar Fe:P ratio, OM %, applied dosages and abbreviation of the tested P fertilization treatments. *P dosage in % of 30 kg P ha−1 year−1 (yearly maximum allowed P load according to the Danish Agricultural Agency)
Table 2. Parameters of the soil used for the plant growth and column diffusion experiment. Soil analyses were performed by a commercial laboratory (OK Laboratorium for Jordbrug, Viborg, Denmark, 2021) according to Sørensen and Bülow-Olsen (Citation1994)
Figure 1. Growth stage evaluation after Zadoks’ decimal code (Zadoks et al., Citation1974). The number of fully unfolded leaves (A) and developed tillers (B) per plant was averaged per pot and plotted over time. Color intensity increases with leave and tiller number.
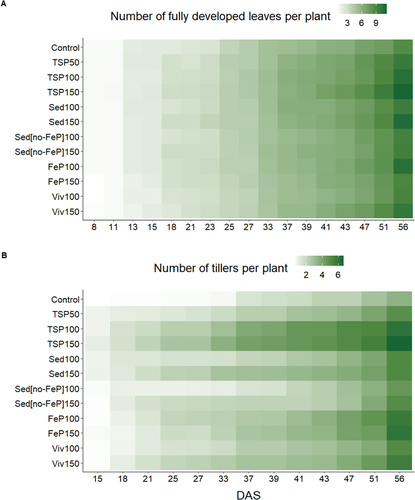
Figure 2. Dry biomass yield and P uptake by barley shoots (A, C) and roots (B, D) in response to the alternative P fertilizer treatments. Treatments with the same letter are not significantly different. The dosage levels 50, 100, and 150 correspond to 50, 100, and 150 % of the Danish maximum yearly P load of 30 kg ha−1. Mean ± SE, n = 5.
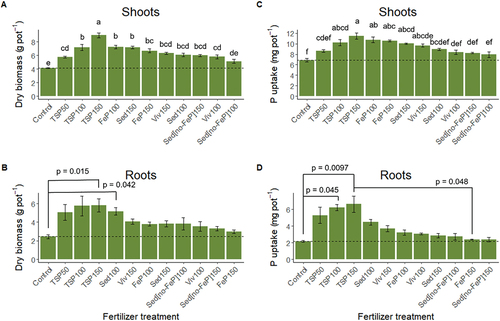
Table 3. Final total P, Fe, Cu, Cd, and Zn content in the barley shoots (mg g DW−1) and total C and N (weight %). For total K, Mg, Mn, and Ca content of barley shoots see supplementary material (SI Table E1). Mean ± SE, n = 5. Values with the same footnote letter are not significantly different (one-way ANOVA). Star signs: * p = 0.045, ** p = 0.036, (*) p = 0.017, *** p = 0.005, (***) p = 0.002 (Kruskal–Wallis test)
Table 4. Soil EC, pH, OM %, water extractable P (WEP), and DGT SRP-flux in the soil with and without barley at 56 DAS (harvest day). Mean ± SE. Treatments with the same letter are not significantly different
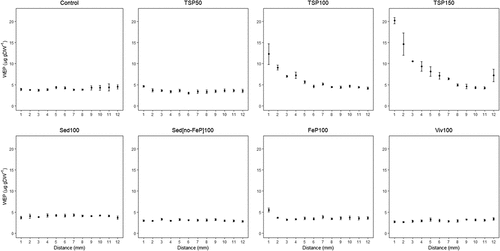
Figure 3. Phosphorus diffusion patterns from the tested substrates presented as soil WEP concentration as a function of distance from the substrate. Mean ± SE, n = 5.
Supplementary material_Sediment P recycling.docx
Download MS Word (4.4 MB)Data availability statement
The data that support the findings of this study are available from the corresponding author, S. Haasler, upon reasonable request.