Figures & data
Figure 1. Stress–plastic strain curves of two simplest and proposed work-hardening models estimated from instrumented indentation test.
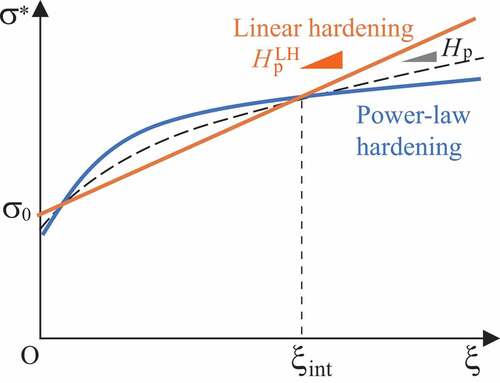
Figure 2. Finite element model of instrumented indentation test.
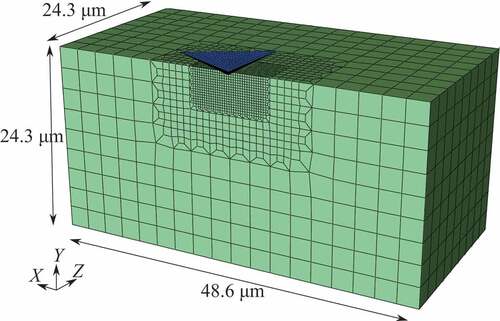
Figure 3. Response surfaces of normalized loading curvature and pile-up height for ,
, and
in
GPa and
. Surface of
MPa was indicated to use for validation.
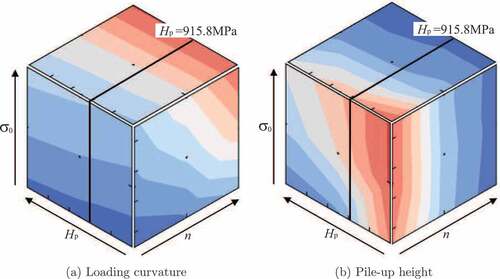
Figure 4. Response surfaces for power-low hardening ( GPa,
, and
MPa). Black lines and a rhomboid mark were drawn for validation.
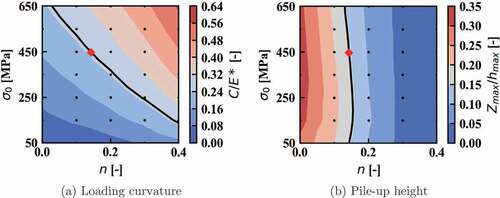
Figure 5. Response surfaces for power-low hardening ( GPa,
, and
). Black lines and a rhomboid mark were drawn for validation.
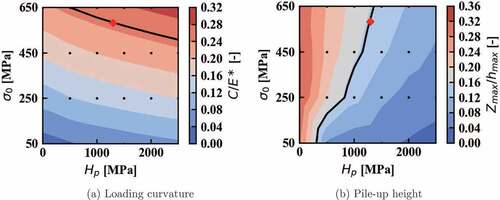
Figure 6. Experimental results.
Table 1. Experimental results of loading curvatures and pile-up heights: data of 12 indentation tests.
Table 2. Experimental results of loading curvatures and pile-up heights: average value and deviations of 12 indentation tests.
Figure 7. Stress–plastic strain curves of two simplest work-hardening models estimated from instrumented indentation test.
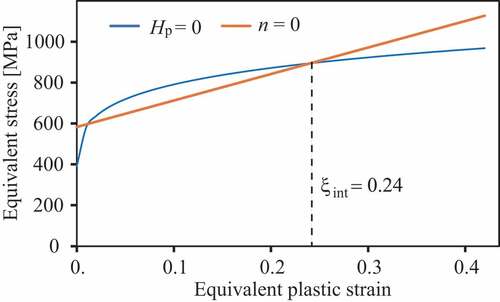
Figure 8. Response surfaces for combined hardening model ( GPa,
, and
MPa).
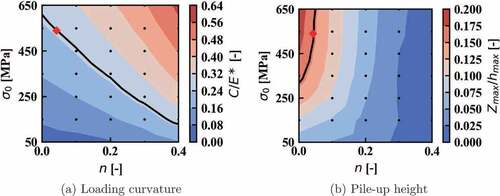
Figure 9. Validation: simulation results using estimated material constants.
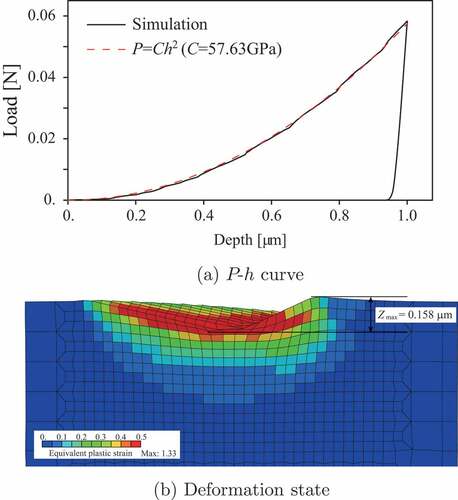
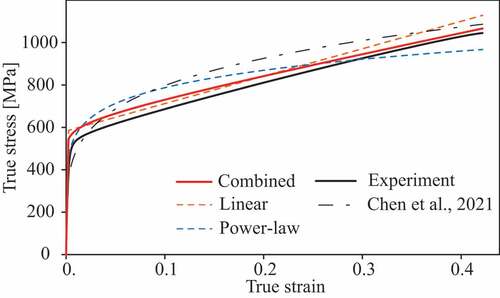
Figure 10. Validation: stress–strain curves estimated from instrumented indentation test.