Figures & data

Figure 1. An experimental setup of the simultaneous PA and PL measurement to estimate the IQE values of the InGaN-QW sample. (a) A schematic diagram of the simultaneous PA and PL measurements system. (b) A photo of the actual experimental system. The PA measurement system (the PA cell and the microphone) is located on the vibration isolation table. (c) A photo of the PA cell and the microphone system located on the vibration isolation mat. An InGaN-QW sample in the cell is irradiated by laser beam.
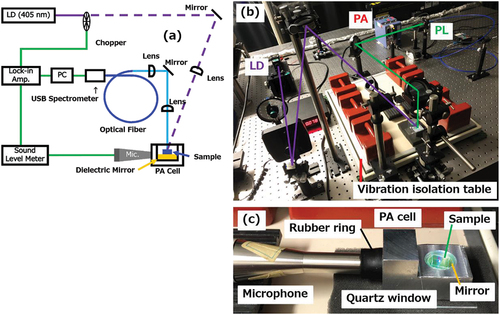
Figure 2. A comparison of (a) the measured acceleration spectra of optical table vibration for the three directions and (b) a background noise spectrum in the PA measurements.
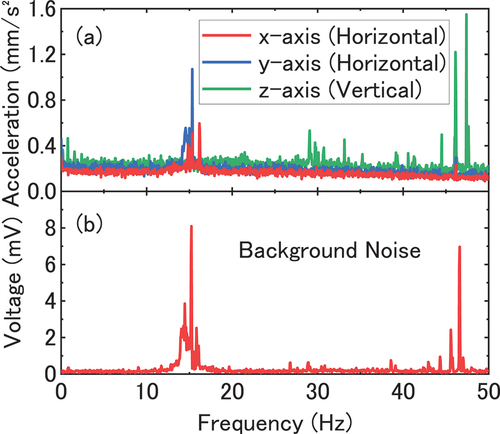
Figure 3. A comparison of the background noise in the PA measurement between the cases (a) without a vibration isolation table and (b) with a vibration isolation table.
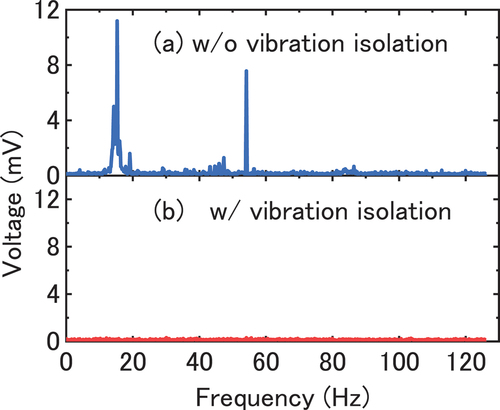
Figure 4. Time fluctuation of the PA signal intensity of an InGaN-QW sample and background noise (with and without vibration isolation) measured by lock-in amplifier in the PA measurement (modulation frequency: 25 hz, laser excitation density: 0.06 kW/cm2).
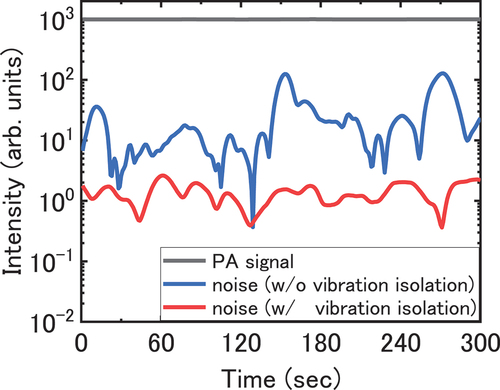
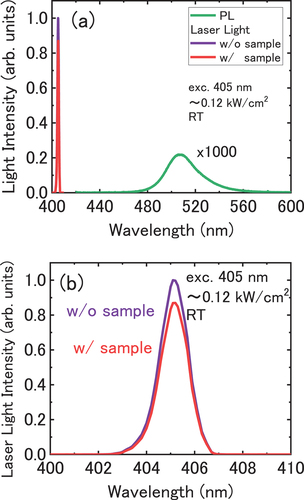
Figure 5. A room-temperature PL spectrum of an InGaN-SQW sample grown on a sapphire substrate. A 405-nm laser diode was used as an excitation source, and the excitation power density was ~0.12 kW/cm2.
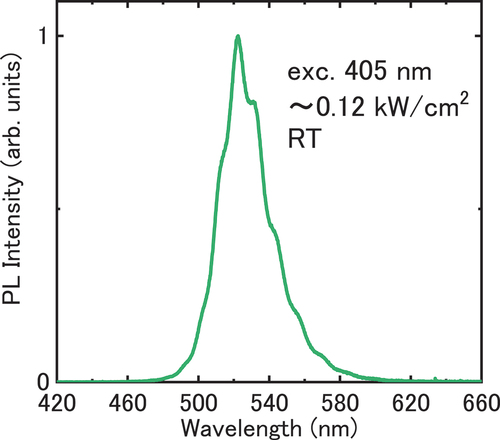
Figure 6. (a) a measured excitation light density dependence of PA and PL intensities for the InGaN-SQW sample. The sum of PA and PL intensities (mere sum of numbers of nominal signal intensities) are also plotted. (b) The data obtained by dividing these data in (a) by excitation light density. The broken lines in both the figure are guide lines which corresponds to linear relationship between signal intensity and excitation light density.
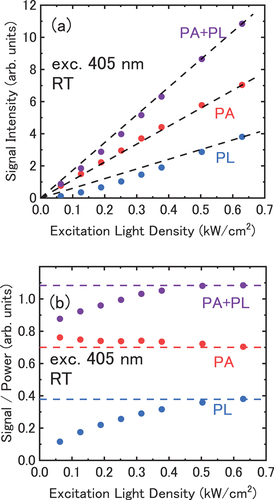
Figure 7. The same data as those shown in fig. 6, but rescaled by multiplying the PA and PL signals so that the PA+PL data can be on a flat line. The horizontal broken lines show guide lines, and the vertical line corresponds to excitation light density of 0.12 kW/cm2 under which condition the EQE measurement was performed for the same sample.
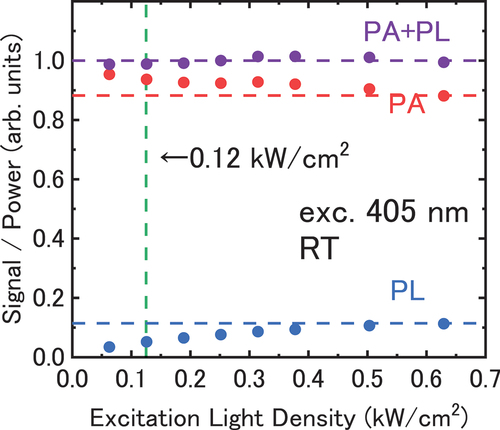
Figure 8. The excitation light density dependence of the calibrated IQE value for the InGaN-SQW sample. The measurements have been carried out twice to check the reproducibility, and the results showed good reproducibility.
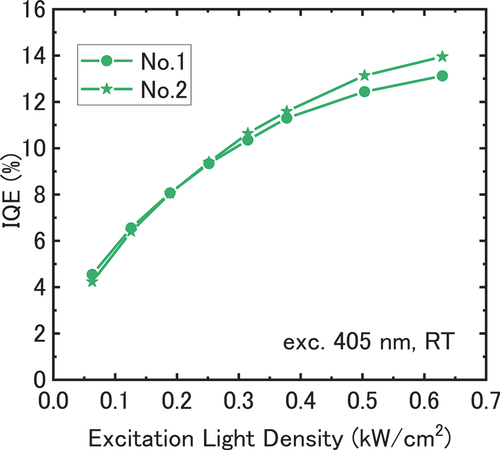
Figure 9. An experimental setup of the EQE estimation measurement using an integrating-sphere. (a) A schematic diagram of the EQE estimation measurement system. The excitation condition in the EQE measurement system is the same as that in the IQE estimation measurement system. (b) A photo of the actual experimental system. (c) A photo of an InGaN-QW sample in the integrating-sphere. Because the side lid is removed for photography, it is seen that the sample is emitting light. (d) A photo of the optical systems for light coupling to optical fibers. The laser light cut filter (405 nm) was used for the PL measurement.
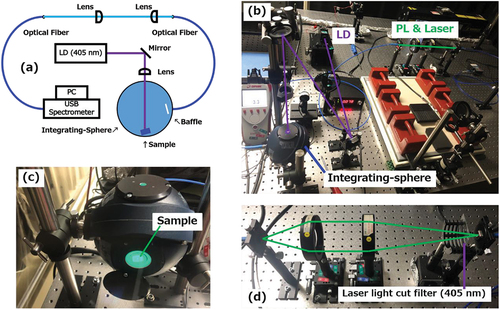
Figure 10. (a) Measured PL spectrum of the InGaN-SQW sample (green line) and the spectra of excitation laser light for the cases with (red line) and without (blue line) the sample in the integrating-sphere. (b) The magnified view of laser emission spectra shown in (a).