Figures & data
Figure 1. a) Regional map of the study area with tectonic boundaries, mainshock and aftershock locations (Basemap courtesy NOAA). The area within the red box is enlarged in (b). b) Porgera earthquake epicenter and location of the mapped landslides represented as points that correspond to their size. The red box is the extent of the study area mapped for landslides. The base map of the study area is the interferogram of the earthquake obtained from: https://www.gsi.go.jp. c) and d) Sample of landslide polygons in the study area. It can be seen that these polygons correspond to the decorrelated parts of the interferogram.
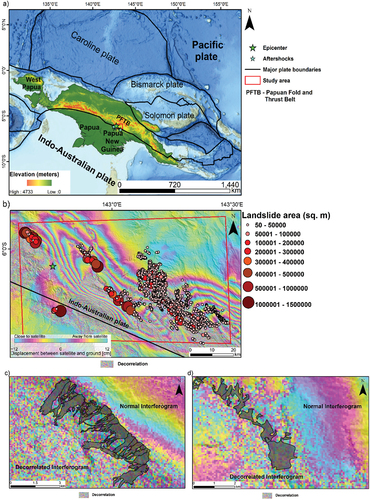
Figure 2. Geological map of the study area (source PNG geological survey). Fault trace adapted from S. Wang et al. (Citation2020).
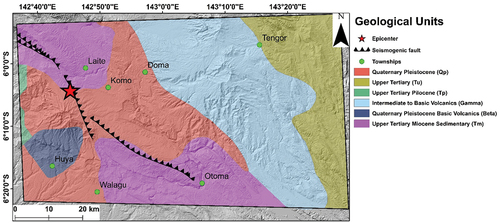
Figure 3. Flow chart of the methodology followed in this work with hierarchy of steps used to carry out the scientific investigation.
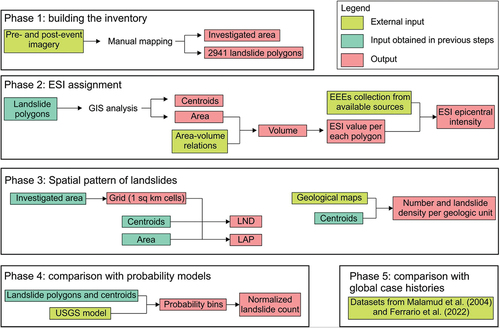
Figure 4. a) Pre-event images of Sector a captured on 13 January 2018. b) Post-event images of Sector A, taken on 20 March 2018. c) Pre-event image of Sector B captured on 4 February 2018. d) Post-event image of Sector B taken on 27 March 2018 (see for locations and lat-long details of the sectors). e) Shows an example of riverbank collapse along Tagiri River acquired from Google earth (Citation2018) imagery post the earthquake.
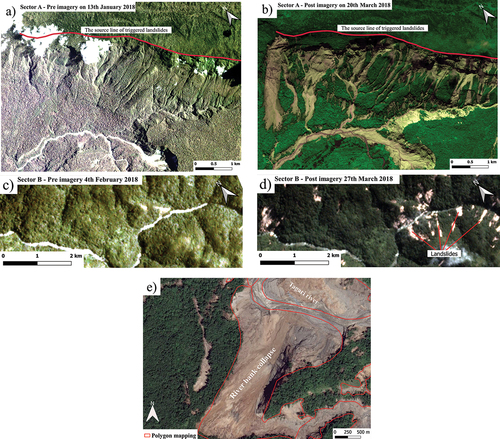
Table 1. Summary of the characteristics of earthquake-triggered landslides and related ESI intensity. Modified after Michetti et al (Citation2004, Citation2007).
Figure 5. a) Landslide Number Density (LND) and b) Landslide Area Percentage (LAP), computed on a 1-km2 grid. Dashed boxes are enlarged in (Basemap: Digital Elevation Model (DEM) derived from ALOS data.).
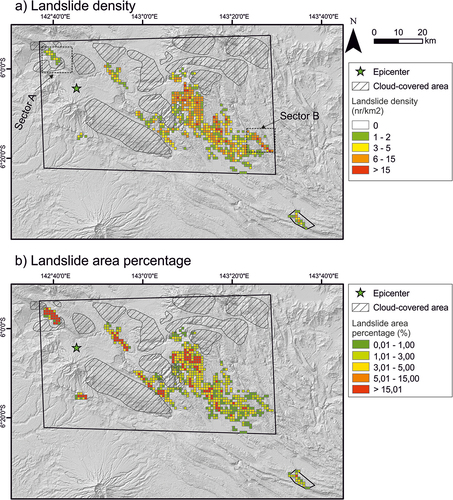
Figure 6. Variation of landslide count and area density in each geological unit present inside the study area.
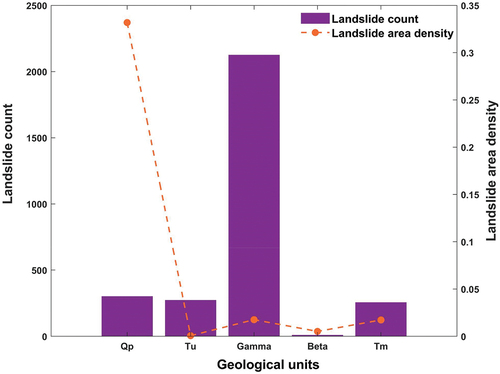
Figure 7. a) Log–log plot of area–volume for various relations proposed in the literature. b) Frequency distribution of landslide area. c) Plot of the cumulative frequency of landslide volumes and relation with ESI intensity; the all-type Larsen et al. (Citation2010) scaling relation is shown as an example. A similar relation is observed using all the equations illustrated in the box in the upper right corner.
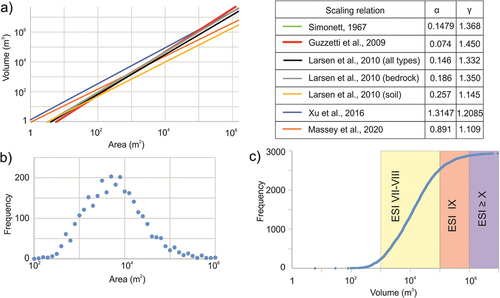
Table 2. ESI epicentral intensity of the Porgera earthquake as obtained from different descriptors, including primary and secondary effects. The ESI epicentral intensity as estimated in this study is XI.
Figure 8. Variation in normalised landslide density as a function of the probability values predicted by (Jessee et al., 2018). The density is calculated for bins with incremental probability values of 0.005. The procedure for calculating the normalized density is mentioned in section 3.1.
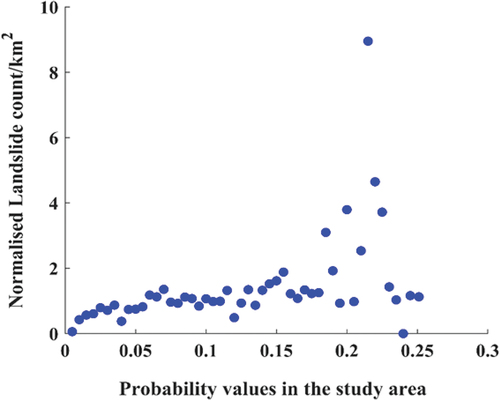
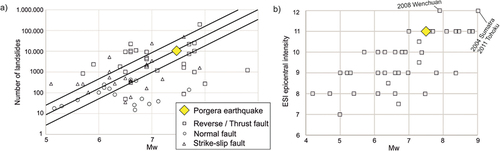
Figure 9. a) The number of triggered landslides versus Mw for 65 events worldwide (modified after (Livio & Ferrario, Citation2020)). The empirical correlation and error bounds adopted from Malamud et al. (Citation2004) are shown as solid lines. b) ESI epicentral intensity versus Mw for a dataset of 47 earthquakes with reverse/thrust mechanisms worldwide.