
Figures & data
Figure 1. (a) Location of the study area; (b) Hydrogeological map of the study area; (c) Tunnel structure and sampling point distribution of Mahuang Cave; (d) Overlying land use image of Mahuang Cave.
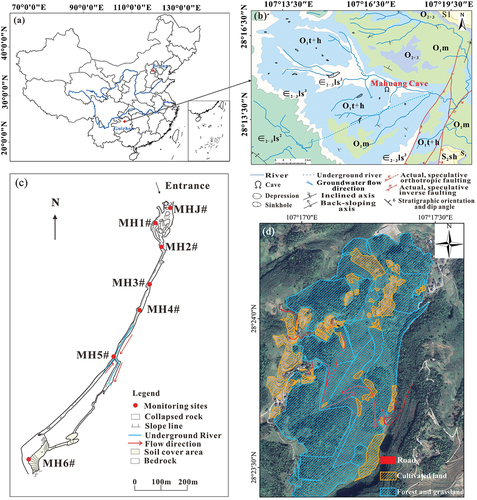
Figure 2. Flow paths for cave water recharge.
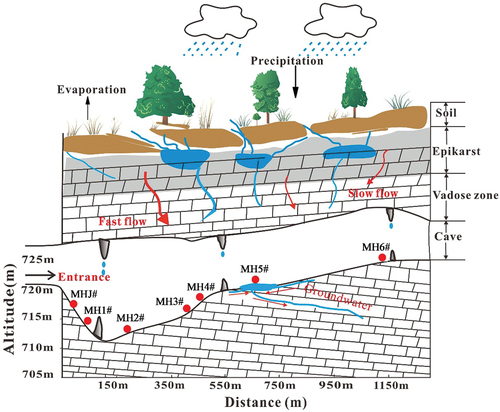
Table 1. Sampling points and water sample types.
Table 2. Variation characteristics of the main hydrochemical parameters in the study area.
Figure 3. Characterization of changes in major ions.
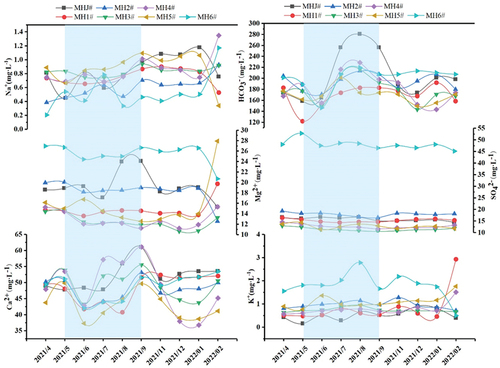
Figure 4. Piper diagrams of the cave water.
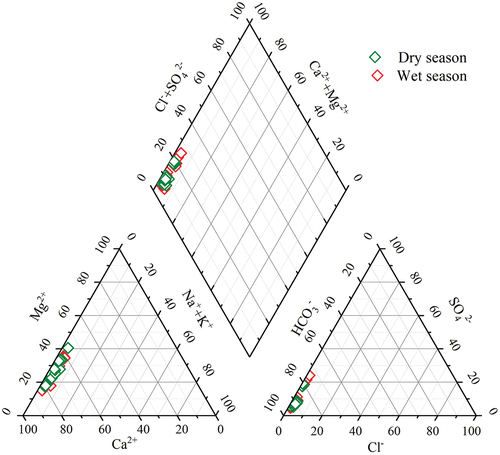
Figure 5. Seasonal variations of δ15N-NO3−, δ18O-NO3− and δ18O-H2O in the cave water during the (a) dry and (b) wet seasons.
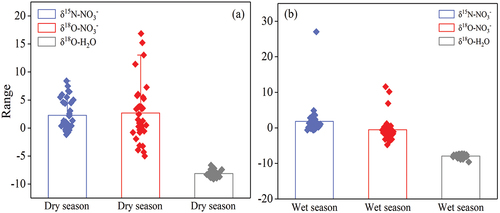
Figure 6. Relationships between NO3−, NO3−/Cl− and Cl−.
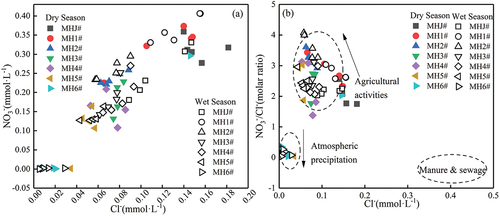
Figure 7. Relationships between δ15N-NO3− and δ18O-NO3− in the (a) dry and (b) wet seasons and relationships between ln(NO3−/Cl−) and δ15N-NO3 in the (c) dry and (d) wet seasons in the cave water.
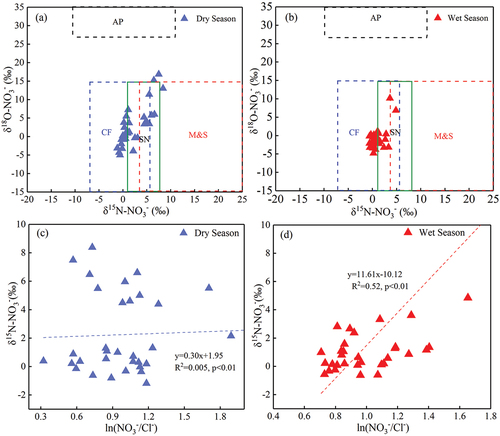
Figure 8. Relationships of NO3− with (a) δ15N-NO3− and (b) dissolved oxygen, and relationships of ln(NO3−) with (c) δ15N-NO3− and (d) δ18O-NO3− in the cave water.
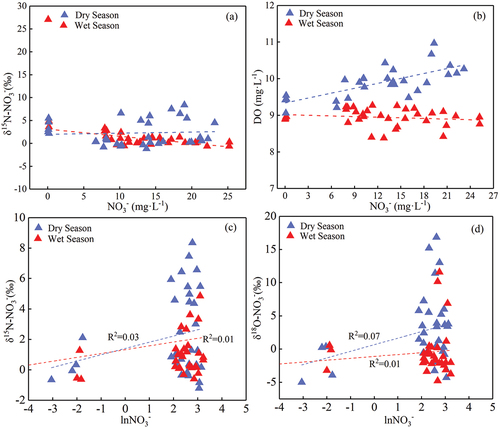
Figure 9. Relationships between δ18O-NO3− and δ18O-H2O in the cave water.
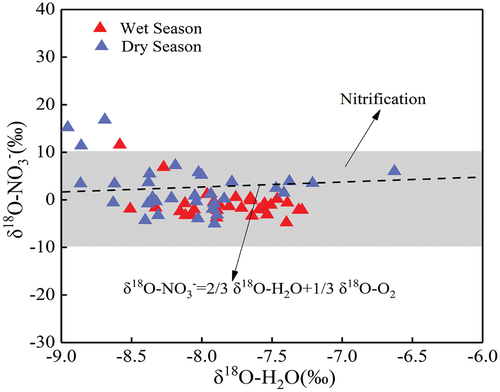
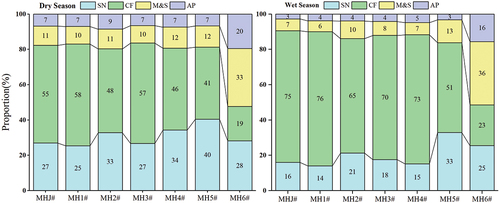
Figure 10. Contribution rates of different nitrate sources in the cave water.
Data availability statement
Data will be provided by the authors upon a written request.