
Figures & data
Figure 1. Study area location.
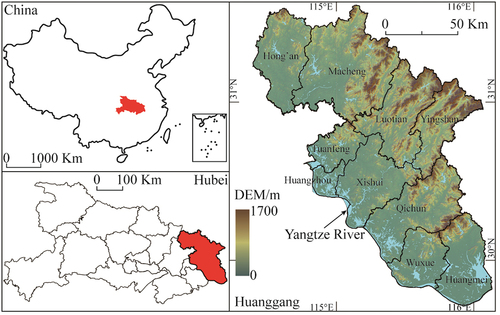
Table 1. Comprehensive evaluation index system and data sources in Huanggang City.
Table 2. Result of weights.
Figure 2. Functional potentiality of land. (a) α = 0.5 (protection-oriented); (b) α = 1 (balance-oriented); (c) α = 2 (development-oriented).
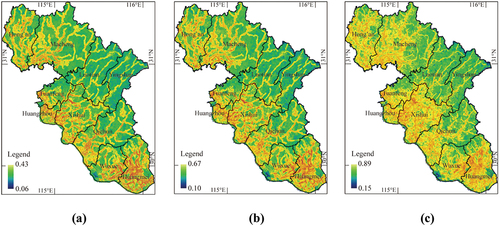
Figure 3. Mean functional potentiality of land in each county.
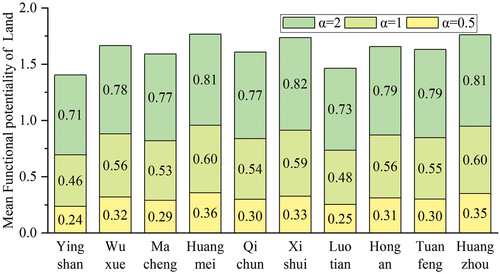
Figure 4. Functional potentiality of water. (a) α = 0.5 (protection-oriented); (b) α = 1 (balance-oriented); (c) α = 2 (development-oriented).
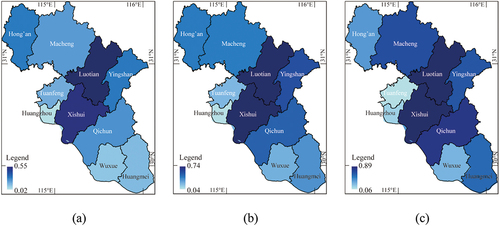
Figure 5. Mean functional potentiality of water in each county.
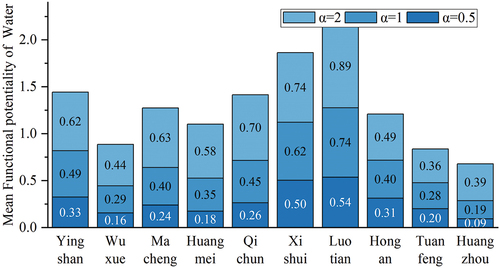
Figure 6. Functional potentiality of forests. (a) α = 0.5 (protection-oriented); (b) α = 1 (balance-oriented); (c) α = 2 (development-oriented).
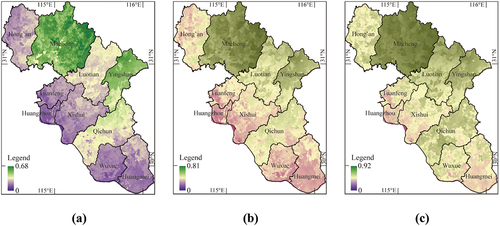
Figure 7. Mean functional potentiality of forests in each county.
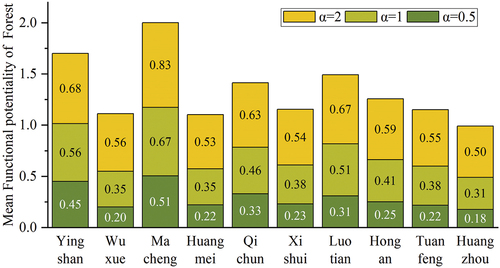
Figure 8. Functional potentiality of wetlands. (a) α = 0.5 (protection-oriented); (b) α = 1 (balance-oriented); (c) α = 2 (development-oriented).
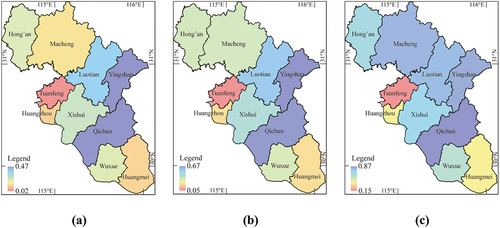
Figure 9. Mean functional potentiality of wetlands in each county.
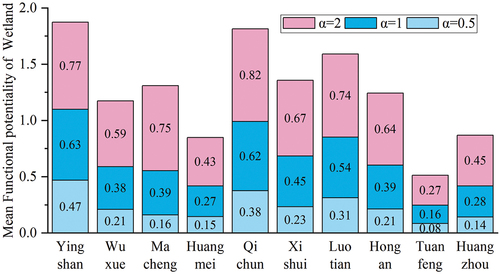
Figure 10. Functional potentiality of minerals. (a) α = 0.5 (protection-oriented); (b) α = 1 (balance-oriented); (c) α = 2 (development-oriented).
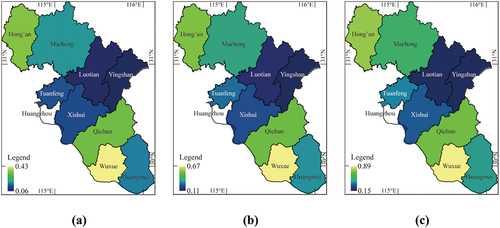
Figure 11. Mean functional potentiality of minerals in each county.
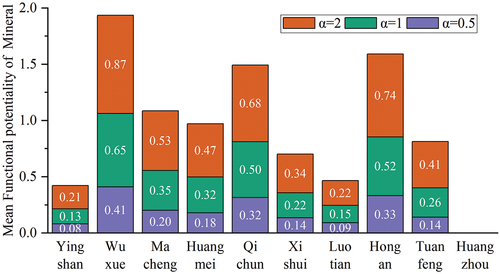
Figure 12. Comprehensive evaluation index of natural resource functional potentiality. (a) α = 0.5 (protection-oriented); (b) α = 1 (balance-oriented); (c) α = 2 (development-oriented).
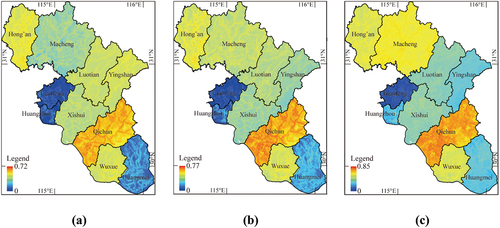
Figure 13. Mean comprehensive evaluation index of natural resource functional potentiality in each county.
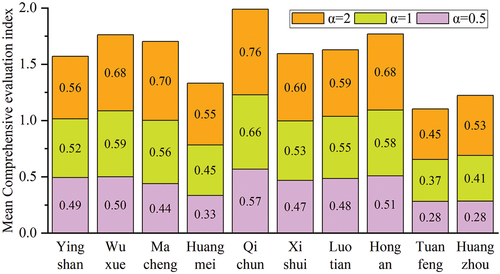
Table 3. Ranking of natural resource functional potentiality.
Table 4. Policy implications for natural resource development in Huanggang City.
Data availability statement
The achievement data of this paper has been uploaded to ScienceDB (doi: 10.57760/sciencedb.18532).