
Figures & data
Figure 1. Comparison of the exact and approximate solution plots for Example 6.1, showing a good agreement between the two.
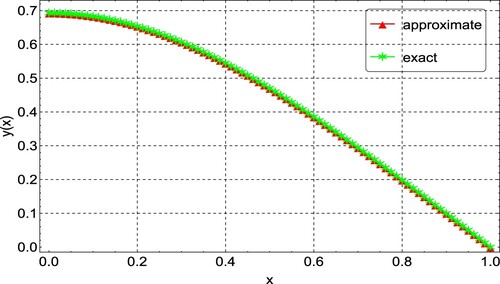
Figure 2. Error plots for the approximation of Example 6.1 for varying values of N.
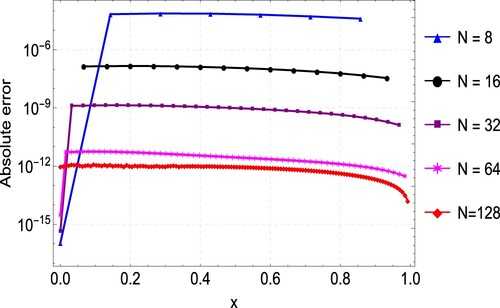
Figure 3. Convergence plots for the approximation of Example 6.1 for varying values of N, showing convergence after 6 iterations.
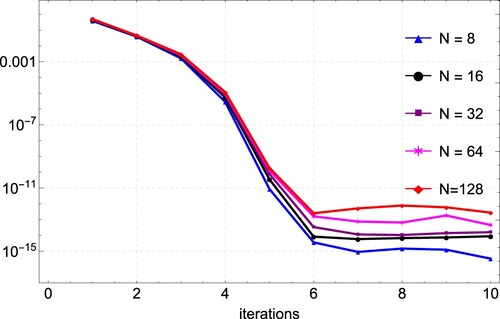
Table 1. Maximum absolute error () for Example 6.1.
Table 2. Maximum absolute error () for Example 6.2.
Figure 4. Comparison of the exact and approximate solution plots for Example 6.2, showing a good agreement between the two.

Figure 5. Error plots for the approximation of Example 6.2 for varying values of N.
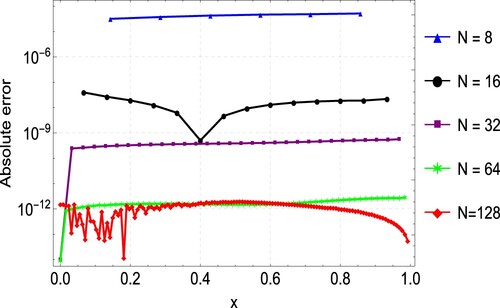
Figure 6. Convergence plots for the approximation of Example 6.2 for varying values of N.
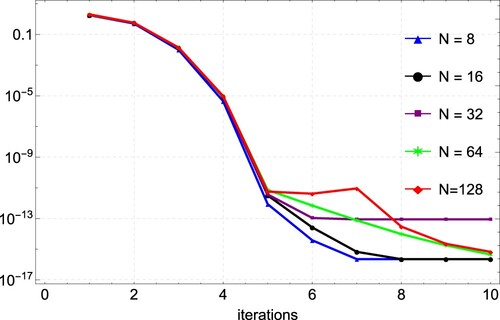
Figure 7. Comparison of the exact and approximate solution plots for Example 6.3 showing a good agreement between the two.
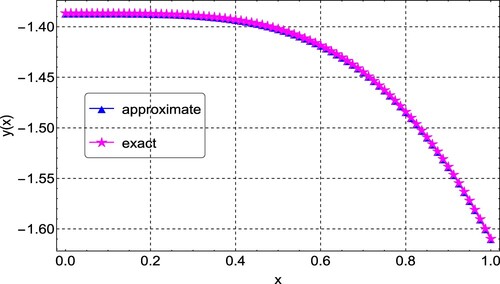
Table 3. Maximum absolute error () for Example 6.3.
Figure 8. Error plots for the approximation of Example 6.3 for varying values of N.
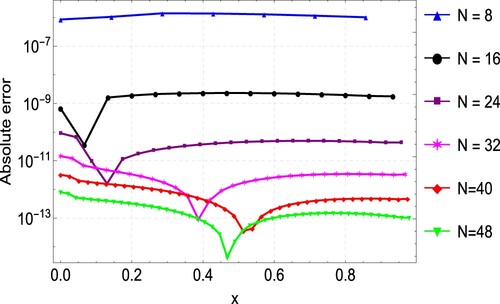
Figure 9. Convergence plots for the approximation of Example 6.3 for varying values of N showing convergence after 5 iterations.
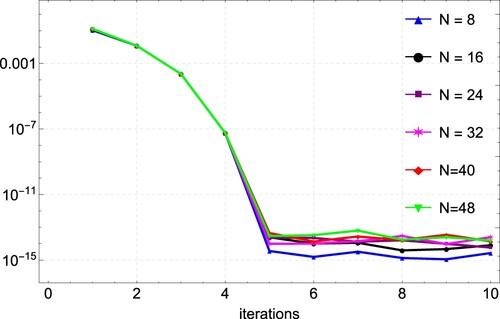
Figure 10. Comparison of the exact and approximate solution plots for Example 6.4, showing a good agreement between the two.
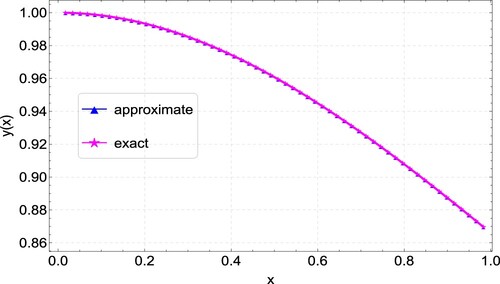
Figure 11. Error plots for the approximation of Example 6.4 for varying values of N.
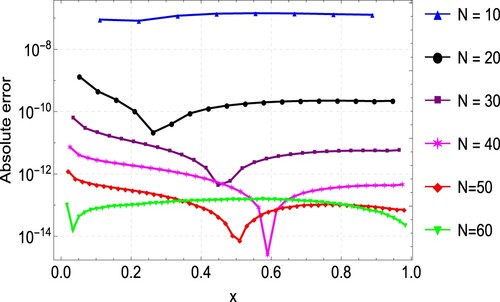
Figure 12. Convergence plots for the approximation of Example 6.4 for varying values of N, showing convergence after 5 iterations.
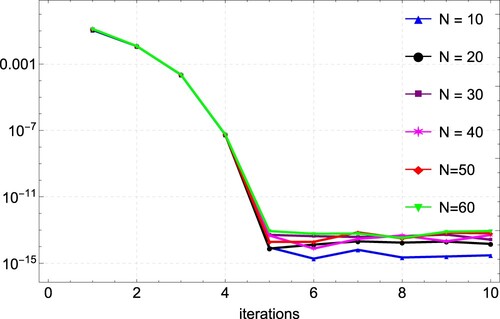
Table 4. Maximum absolute error () and
for Example 6.4.
Table 5. Maximum absolute error () and
for Example 6.5.
Figure 13. Comparison of the exact and approximate solution plots for Example 6.5, showing good agreement between the two.

Figure 14. Error plots for the approximation of Example 6.5 for varying values of N.

Figure 15. Convergence plots for the approximation of Example 6.5 for varying values of N, showing convergence after 6 iterations.
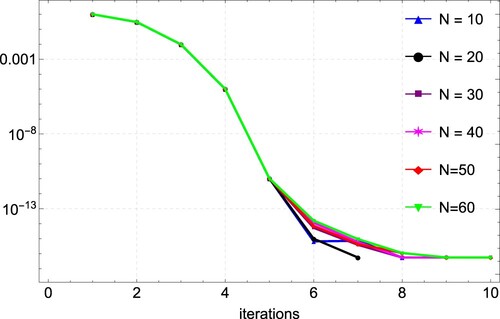
Figure 16. Approximate solution plots for Example 6.6 for N = 20.
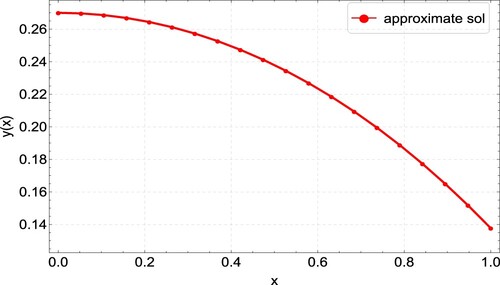
Table 6. Maximum absolute error () for Example 6.6.
Figure 17. Approximate solution plots for Example 6.7 for N = 20.
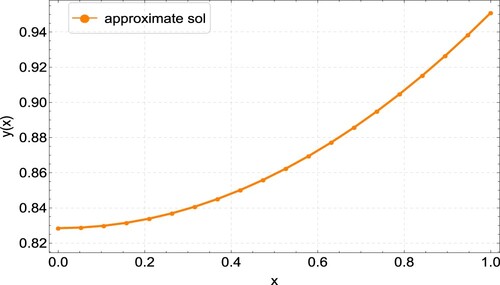
Table 7. Maximum absolute error () for Example 6.7.