2,187
Views
3
CrossRef citations to date
0
Altmetric
Report

TFEBexplorer: An integrated tool to study genes regulated by the stress-responsive Transcription Factor EB

ORCID Icon, , , ORCID Icon, ORCID Icon, ORCID Icon, & ORCID Icon show all

Figures & data

Figure 1. The TFEBexplorer interface. Given a set of genes in input (query), the results of the Search are displayed in different panels, each reporting results of experiments or bioinformatic analyses: (A) TFEB gene perturbation panel includes: a time-series box with expression changes of the query genes over time following inducible TFEB overexpression in human HEK293 cells; a network box with a network representation showing query genes as nodes (red=direct TFEB targets; cyan filled circles=autophagy pathway gene); and a gene expression profile box listing the significant differentially expressed genes in the query in the available human and mouse transcriptional datasets; (B) Bioinformatic prediction panel reports the genome-wide predictions of TFEB CLEAR binding sites; (C) Experimental ChIP-seq panel lists the TFEB binding sites in HEK293 and HeLa cells identified in published Chromatin immunoprecipitation followed by sequencing experiments (ChIP-seq); (D) Visualization of binding site panel is opened by clicking on the “IGV” link and shows a gene-wise graphical representation of the binding sites in panel B and C along the genomic region in the Integrative Genome Browser.

Figure 1. The TFEBexplorer interface. Given a set of genes in input (query), the results of the Search are displayed in different panels, each reporting results of experiments or bioinformatic analyses: (A) TFEB gene perturbation panel includes: a time-series box with expression changes of the query genes over time following inducible TFEB overexpression in human HEK293 cells; a network box with a network representation showing query genes as nodes (red=direct TFEB targets; cyan filled circles=autophagy pathway gene); and a gene expression profile box listing the significant differentially expressed genes in the query in the available human and mouse transcriptional datasets; (B) Bioinformatic prediction panel reports the genome-wide predictions of TFEB CLEAR binding sites; (C) Experimental ChIP-seq panel lists the TFEB binding sites in HEK293 and HeLa cells identified in published Chromatin immunoprecipitation followed by sequencing experiments (ChIP-seq); (D) Visualization of binding site panel is opened by clicking on the “IGV” link and shows a gene-wise graphical representation of the binding sites in panel B and C along the genomic region in the Integrative Genome Browser.

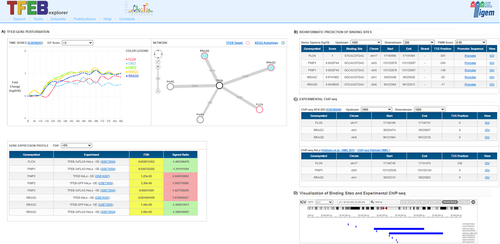
Table 1. Browser compatibility

Supplemental material

Supplemental Material

Download MS Excel (9.3 KB)