
Figures & data
Figure 1. Flow chart of study participants.
Table 1. Socio-demographic profile of participants.
Table 2. Dispersion parameters for physicians’ behavioural intention.
Table 3. Impact of course on medical specialists’ intention.
Figure 2. Box plots of psychosocial factors of intention.
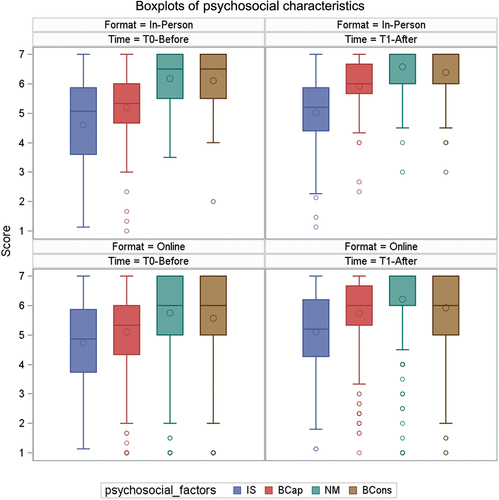
Table 4. Changes in psychosocial factors before and after courses.
Table 5. Frequencies of self-reported behaviour according to CPD course format (N = 56).
Figure 3. Box plots of intention after course according to self-reported adoption or not of target behaviour at six-month follow-up.
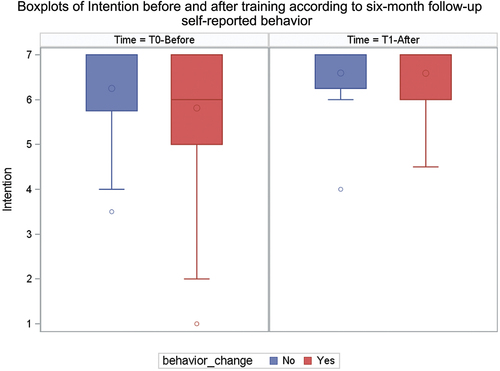
Figure 4. Observed gain or loss of intention compared to self-reported behaviour six months after CPD course.
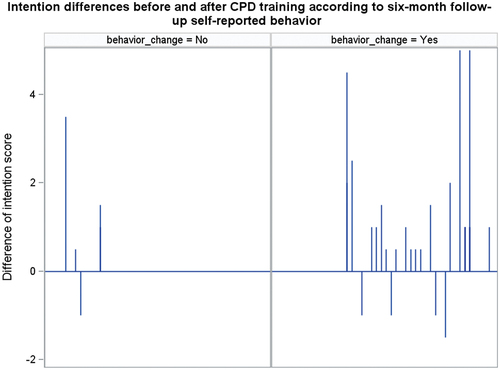
Table 6. Association between intention and self-reported behaviour (N = 56).
Table 7. Self-reported behaviour and association with behavioural intention’s evolution before-after courses (N = 56).