Figures & data
Table 1. Descriptive and mean comparison data for reading disabled (RD), Gifted (G), and Gifted-Reading Disabled (GRD) subjects a and b.
Table 2. Regions of interest.
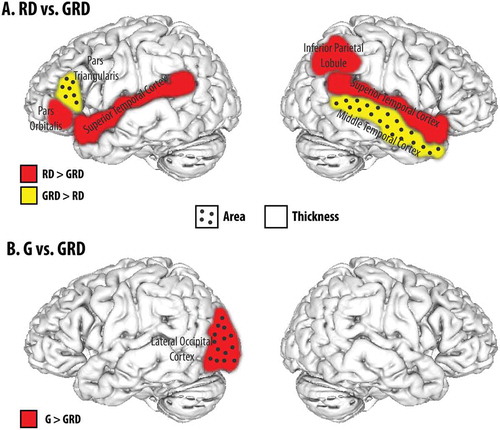
Table 3. Significant (p ≤ 0.05) ROIs Contrasting G to GRD or RD to GRDa.
Figure 1. Regions-of-Interest exhibiting significant anatomical between-group differences.