Figures & data
Figure 1. Processes involved in word production in picture naming and in naming from definition tasks (see text for details).
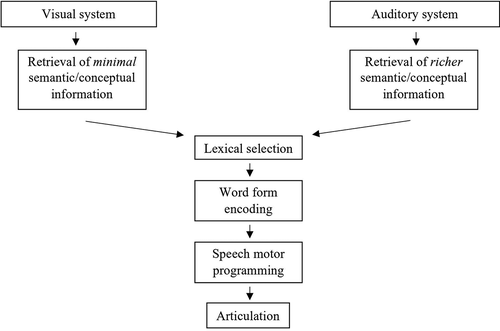
Figure 2. Naming accuracy (in %) and reaction times (RT; in ms) for groups and tasks. Error bars represent the SD.
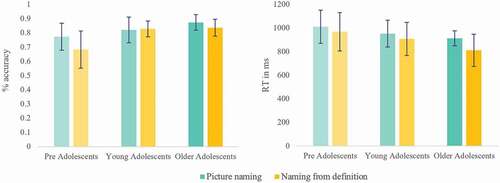
Figure 3. Picture naming task. (a) Exemplar condition-averaged Event-Related Potential waveform (Oz) for the three groups plotted in microvolts in function of time. (b) Periods of significant differences (in red p < .01, in yellow p < .05, in white p ≥ .05) in amplitudes between the three groups on each electrode and time-frame for the stimulus-locked and response-locked Event-Related Potentials. (c) Periods of significant differences in the topographic ANOVA analysis (p < .01) in turquoise.
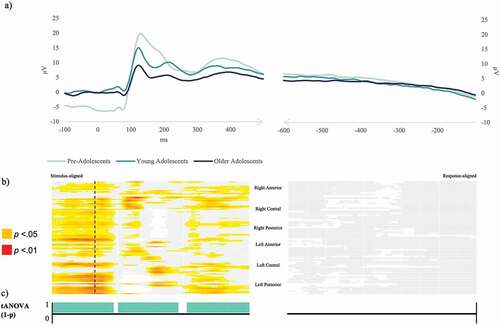
Figure 4. Naming from definition task. (a) Exemplar condition-averaged Event-Related Potential waveform (Oz) for the three groups plotted in microvolts in function of time. (b) Periods of significant differences (in red p < .01, in yellow p < .05, in white p ≥ .05) in amplitudes between the three groups on each electrode and time-frame for the stimulus-locked and response-locked Event-Related Potentials. Visualization of electrode sites yielding significant difference are highlighted on the scalp exemplar. (c) Periods of significant differences in the topographic ANOVA analysis (p < .01) in turquoise.
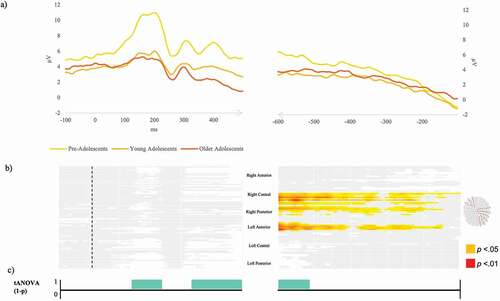
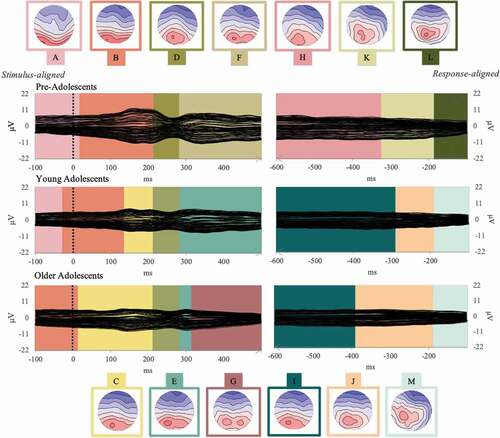
Figure 5. Group-averaged event-related potentials for the picture-naming task (Event-Related Potentials; 128 electrodes, each displayed as a black plotted line) for each group (pre-adolescents, young adolescents, and older adolescents) from 100 ms before stimulus onset to 500 ms and from −600 to 100 ms before vocal onset. The temporal distribution of the topographic maps in each data set revealed by the spatio-temporal segmentation analysis is superposed with code colors. The 13 corresponding template maps are displayed with positive values in red and negative values in blue.
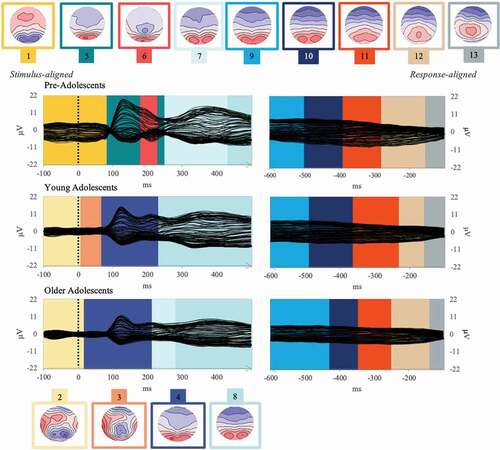
Figure 6. Group-averaged event-related potentials for the naming from definition task (Event-Related Potentials; 128 electrodes, each displayed as a black plotted line) for each group (pre-adolescents, young adolescents, and older adolescents) from 100 ms before the stimulus onset to 100 ms before vocal onset. The temporal distribution of the topographic maps in each data set revealed by the spatio-temporal segmentation analysis is superposed with code colors. The 13 corresponding template maps are displayed with positive values in red and negative values in blue.