Figures & data
Table 1. Scheme of Tested Varieties
Figure .1. Typical deformation curves (variety Lazur). Maturity stages: Green (1a), Green-Brown (1b), and Matured (1c). Y.P. denotes location of yield point(s) on deformation curve(s).
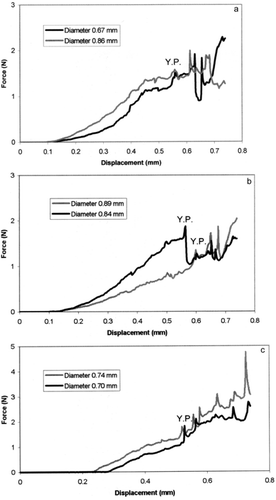
Figure 2. Mean values of seed diameters for the tested samples. The bars denote standard deviations of the samples.
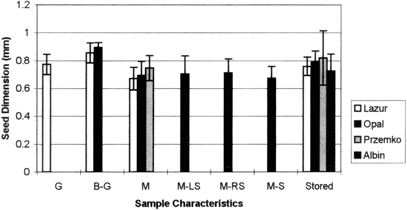
Table 2. Mean Values of the Measured and Recalculated Parameters (LSD–Least Significant Difference)
Figure 3. Mean values of Recalculated Initial Slopes for the tested samples. The bars denote standard deviations of the samples.
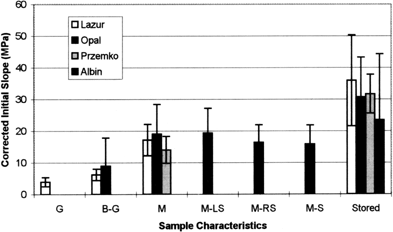
Figure 4. Mean values of Relative Bio-Yield Pressure for the tested samples. The bars denote standard deviations of the samples.
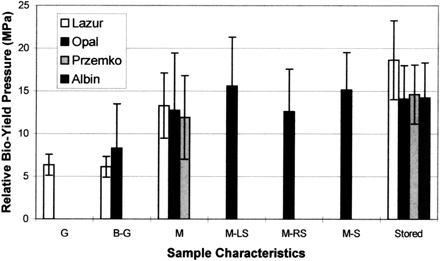
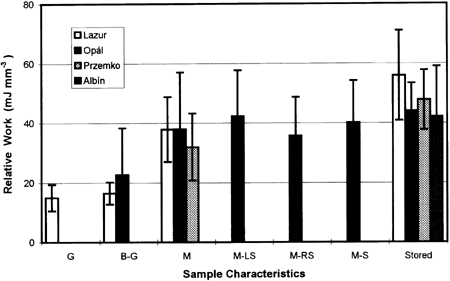
Figure 5. Mean values of Relative Work up to Bio-Yield Point for the tested samples. The bars denote standard deviations of the samples.