Figures & data
Table 1. Summary of Calibration and Validation Results Using PLS Models for Classifying Pecky and Sound Rice Kernelsa
Table 2. The Color Variations Between Pecky and Sound Rice Kernels Measured as L, a, and b Values in the L*a*b Color Space
Figure 1. Absorption curves for pecky and sound rice kernels. Vertical bar represents one standard deviation.
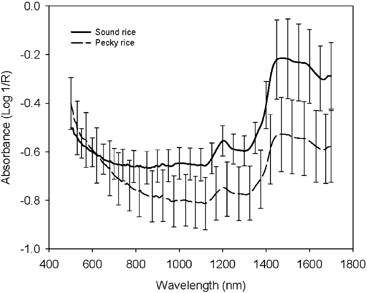
Figure 2. Beta coefficient curve of PLS model (6 PLS factors) for classification of pecky and sound rice kernels.
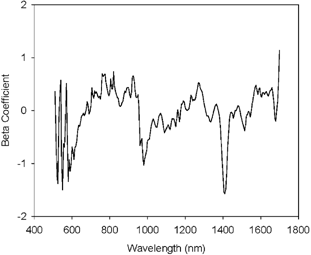
Table 3. Summary of Calibration and Validation Results Using the Linear Discriminant Functions for Classifying Pecky Rice and Sound Rice Kernelsa
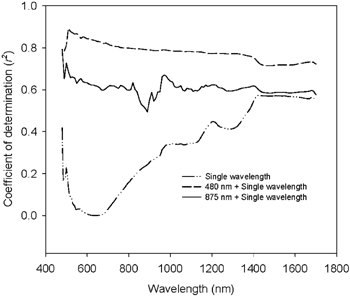
Figure 3. Coefficient of determination (r 2) as a function of single and two wavelengths for single and two-wavelength models.