Figures & data
Table 1 Nutritional information per 100 g of food
Table 2 Relationship between density and temperature
Figure 1 Experimental density data of the tested baby foods at different temperatures: cereals with honey (○), with cocoa (•), without gluten (▪), rice (□).
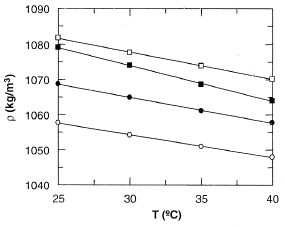
Table 3 Activation energy, ΔE in J/mol, for all tested foods
Table 4 Relationship between η 0 and shear rate
Figure 2 Shear stress vs. shear rate for the tested baby foods at 30°C: cereals with honey (•), with cocoa (○), without gluten (□), rice (▪).
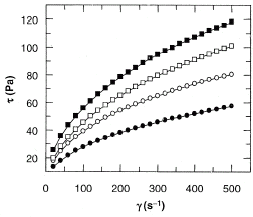
Figure 3 Shear stress vs. shear rate for the tested baby foods at 35°C: cereals with honey (•), with cocoa (○), without gluten (□), rice (▪).
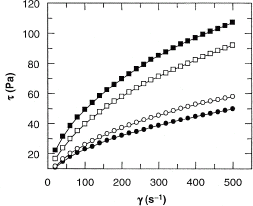
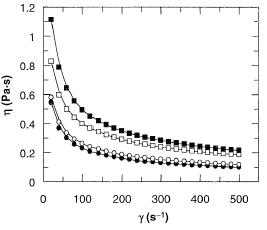
Figure 4 Viscosity vs. shear rate for all foods at 30°C: cereals with honey (•), with cocoa (○), without gluten (□), rice (▪).
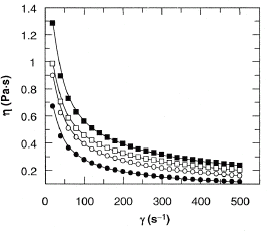
Figure 5 Viscosity vs. shear rate for all foods at 35°C: cereals with honey (•), with cocoa (○), without gluten (□), rice (▪).