Figures & data
Table 1. Sample growth conditions. The ∗ indicates variable rotation rate described below.
Figure 1. A radial cross-section of a thermally oxidized copper rod. This sample has not been polished. There are multiple black inclusions. Thermally oxidized samples are polycrystalline, though grains are not easily visible without polishing.
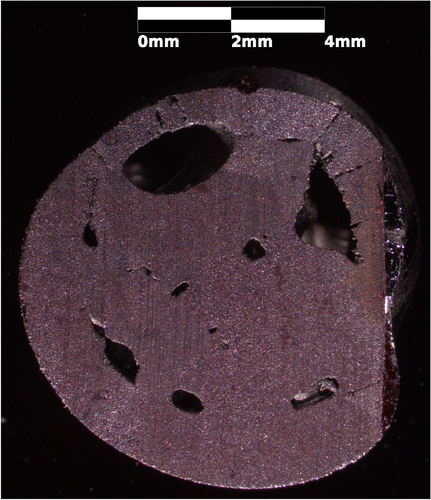
Figure 2. An SEM image of an inclusion in a longitudinally cut and polished slice of the Cu2O support rod used to grow sample A. The floating zone grown region is essentially featureless in the SEM. This inclusion is a cavity rather than CuO though it may have a CuO surface layer. There is low contrast between CuO and Cu2O in SEM images because the compounds have similar density. Notice the fine faceting on the interior of the inclusion.
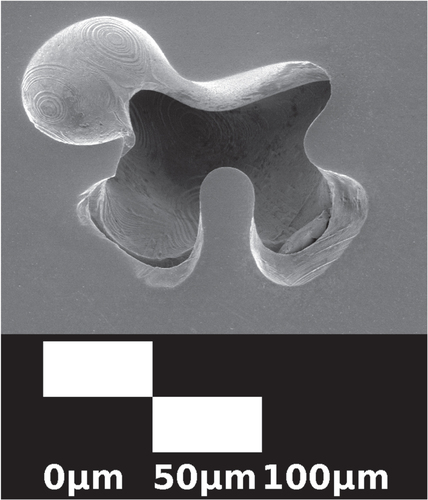
Figure 3. Transmission microscopy image of a polished slice of a cuprous oxide crystal (sample A) that shows the horizontal boundary between the feed rod that was melted (top) and the unmelted support rod (bottom). The boundary is about one third of the way up the image. Dark regions are CuO in the bulk. Light regions are surface defects, which scatter light. The surface defects in the unmelted support rod outnumber all macroscopic defects in the bulk of the melted region. Melting and recrystallization therefore dramatically improves the phase purity of cuprous oxide.
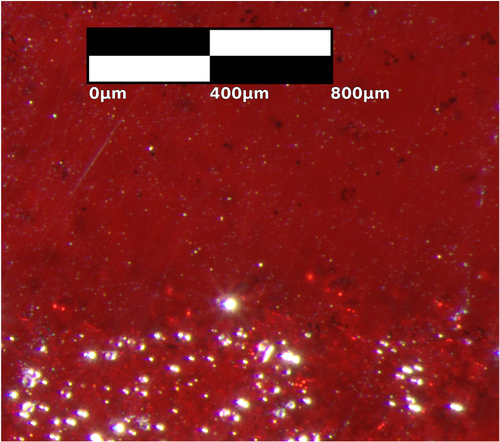
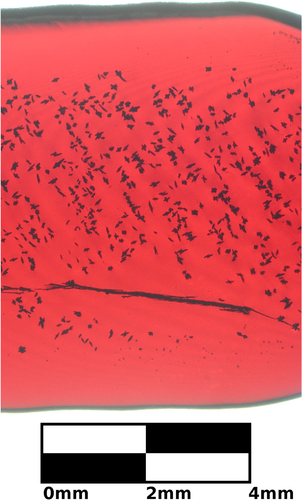
Figure 4. Transmission microscopy image of two sections of sample D that were grown with different counter-rotation rates of feed and support rods. Top: 70 RPM per rod. Bottom: 7 RPM per rod. The counter-rotation rate changes the size, number, and distribution of CuO inclusions, which are small, dark spots.
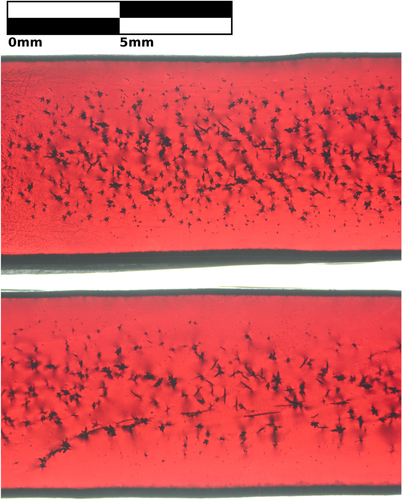
Figure 5. Threshold particle analysis of crystal segments grown with counter-rotation rates of 70 RPM per rod (+ symbol) and 7 RPM per rod (× symbol). The volume and radial position of each inclusion is shown. The inclusions in the crystal grown with a faster rotation rate are more numerous, smaller, and spread farther from the center of the sample. Crystals analyzed were from sample D and are shown in figure .
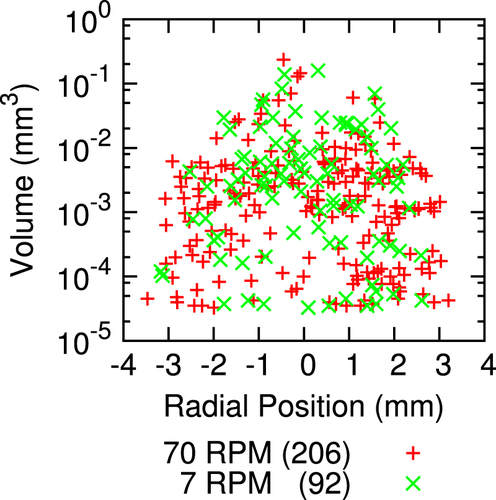
Figure 6. A transmission microscopy image of black CuO inclusions in a Cu2O crystal slice from sample B that has been annealed for 5 d at 1045 °C with heating and cooling rates of 5 °C min−1. The annealed inclusions are small and rounded, but show faceting in contrast with the inclusions before annealing in figure .
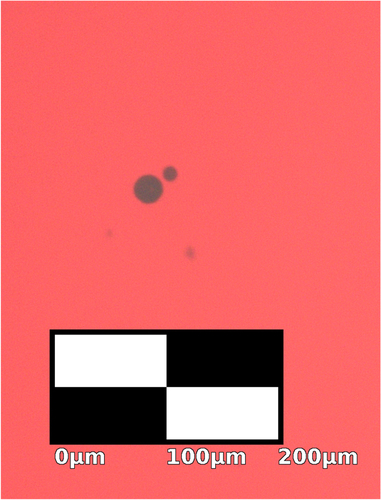
Figure 7. A transmission microscopy image of sample C that shows black CuO inclusions accumulate along a grain boundary. The area around the grain boundary is free of inclusions. Grain boundaries can be avoided if crystals are grown from a single crystal seed rod.