Figures & data
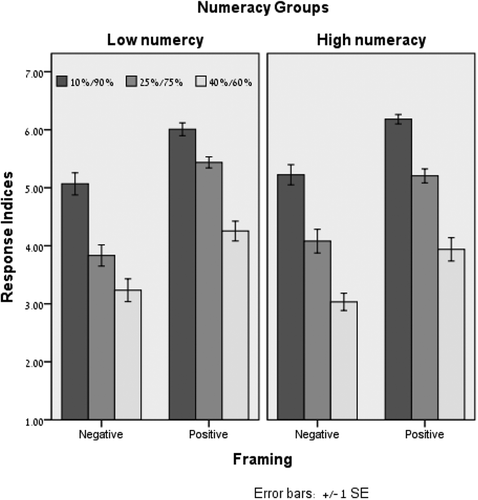
Table 1. Mean response indices of the three outcome proportions as a function of framing and numeracy group (Experiment 1; N = 139)
short-legendFigure 1. 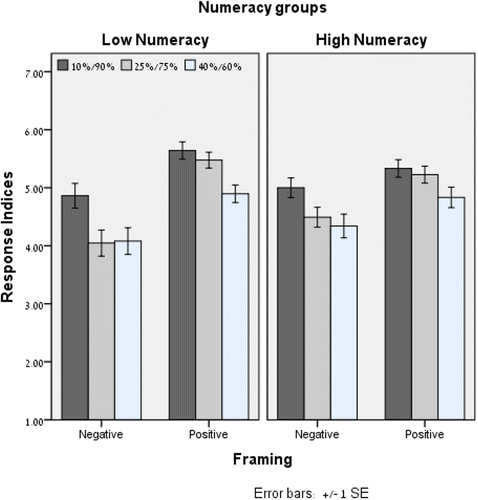
Table 2. Mean response indices of the three outcome proportions as a function of framing and numeracy group (Experiment 2; N = 420)
short-legendFigure 2.