1,248
Views
4
CrossRef citations to date
0
Altmetric
Research Articles

Evaluation of Biomedical Science Students Use and Perceptions of Podcasting

&

Figures & data

Table 1 Proportion of all available audio recordings that students listened to. Table shows percentage of respondents who selected each response (n = 131 respondents).

Figure 1 A pie chart showing how much of the recorded lecture students usually listen to (n = 131 respondents). Most students listened to the whole lecture recording (41–50 minutes).
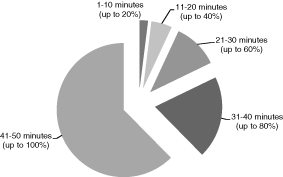
Figure 2 Ways in which students' playback lecture recordings (n = 131 respondents). Ninety-one percent of students listened to recordings from within the virtual learning environment.
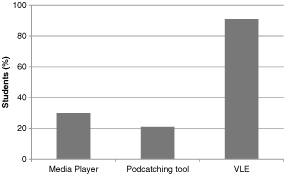
Figure 3 Devices used for listening to audio recordings (n = 131 respondents). Most students used either their personal computer (98%) or laptop (43%) for listening to recordings.

Table 2 Ways in which students used lecture audio recordings in their private study (percentage total exceeds 100% as students could select multiple responses, n = 131 respondents).

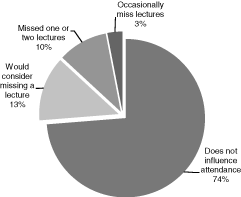
Figure 4 A pie chart showing the influence of podcast availability on lecture attendance (n = 131 respondents). The majority of students stated that the availability of podcasts did not influence lecture attendance.

Reprints and Corporate Permissions

Please note: Selecting permissions does not provide access to the full text of the article, please see our help page How do I view content?

To request a reprint or corporate permissions for this article, please click on the relevant link below:

Academic Permissions

Please note: Selecting permissions does not provide access to the full text of the article, please see our help page How do I view content?

Obtain permissions instantly via Rightslink by clicking on the button below:

If you are unable to obtain permissions via Rightslink, please complete and submit this Permissions form. For more information, please visit our Permissions help page.