Figures & data
Figure 1 Students using Google Earth in a taught class, some for the first time.
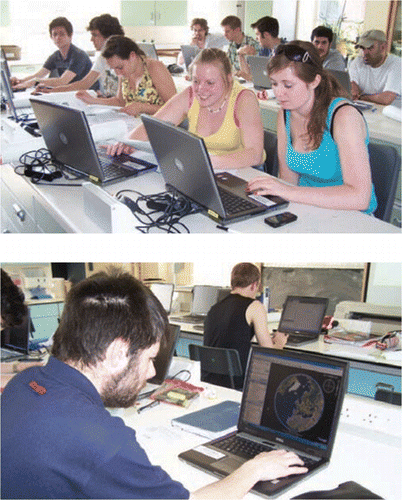
Table 1 Results of 1st Year, 3rd (final) Year, and combined student respondents to the Google Earth prior use survey. Note that the percentages for questions b and c are based on the subtotals responding ‘yes’ to the previous question.
Figure 2 Results of 1st Year student respondents to the Google Earth prior use survey. Note that the percentages for questions b and c are based on the subtotals responding ‘yes’ to the previous question.
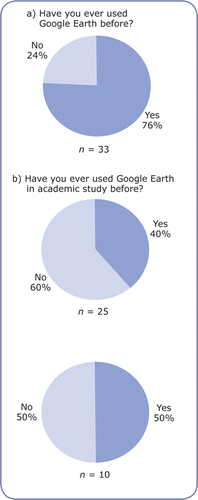
Figure 3 Results of 3rd (final) Year student respondents to the Google Earth prior use survey. Note that the percentages for questions b and c are based on the subtotals responding ‘yes’ to the previous question.
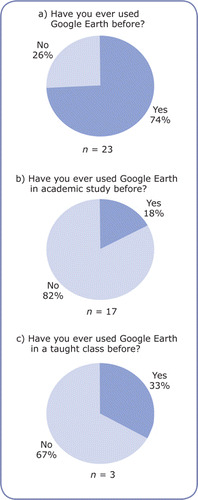
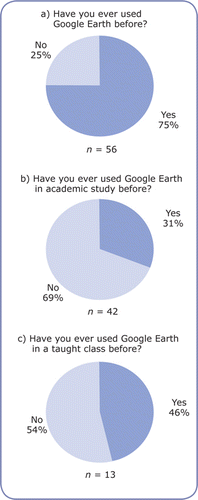
Figure 4 Results of combined student respondents to the Google Earth prior use survey. Note that the percentages for questions b and c are based on the subtotals responding ‘yes’ to the previous question.