Figures & data
Fig 1 Global analysis of Forkhead-box proteins reveals a role for Foxa3 in promoting adipocyte differentiation. (A) aP2 mRNA levels in 10T1/2 cells expressing 35 distinct siRNAs targeting Forkhead genes relative to siRNA control, 72 h after induction of differentiation. (B) aP2 mRNA levels in 3T3-L1 cells after siRNA knockdown of selected Forkhead factors, 72 h after induction of differentiation. (C) Relative mRNA levels of adipocyte markers in 10T1/2 cells expressing either control siRNA (si-control) or Foxa3-siRNA (si-Foxa3), 72 h after induction of differentiation. (D) Oil Red O staining of differentiated 10T1/2 cells expressing either vector or Foxa3 and relative mRNA levels of adipocyte differentiation markers in 10T1/2 cells expressing either vector or Foxa3, at day 6 of differentiation. Data represent means ± SEM (**, P < 0.01; ***, P < 0.001).
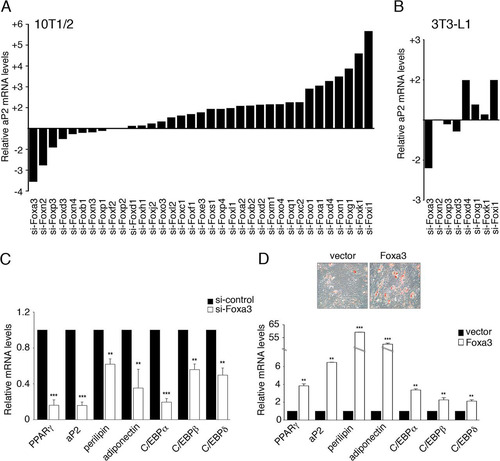
Fig 2 Foxa3 is involved in early stages of adipocyte differentiation. (A) Relative mRNA levels of Foxa3 and of adipocyte markers during 10T1/2 cell differentiation. (B) aP2 mRNA levels in 10T1/2 cells expressing vector, Foxa3, or PPARγ in the presence of either control siRNA or siRNAs targeting C/EBPs or PPARγ, 72 h after induction of differentiation. Values are expressed as relative to the control siRNA values. Data represent means ± SEM (*, P < 0.05; **, P < 0.01; ns, nonsignificant).
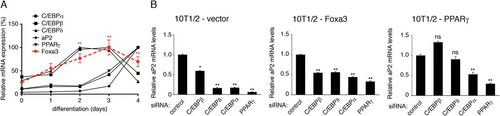
Fig 3 Foxa3 regulates PPARγ expression in cooperation with C/EBPβ and C/EBPδ. (A) C/EBP and Foxa DNA binding sites at the PPARγ2 promoter. (B) Analysis of the transcriptional activity of Foxa3 and C/EBPs on a PPARγ2-promoter luciferase reporter. a.u., arbitrary units. (C) Foxa3 and C/EBPα, -β, or -δ coimmunoprecipitations (IP). WB, Western blot. (D) ChIP assay on Foxa and C/EBP sites at the PPARγ2 promoter at day 2 of adipocyte differentiation. (E) ChIP assay at the C/EBP site present at the PPARγ2 promoter in si-control- and si-Foxa3 3T3-L1-expressing cells at day 2 of adipocyte differentiation. (F) EMSA performed at the Foxa3 binding site using a nuclear extract obtained from U2OS cells expressing either the Foxa3 wild type (Foxa3-WT) or a Foxa3 DNA binding domain mutant (Foxa3-DBD). Supershift (SS) analysis was performed using an anti-Foxa3 antibody. (G) Coimmunoprecipitation of Foxa3-DBD mutant with C/EBPδ. (H) Luciferase activity of Foxa3-WT and Foxa3-DBD mutant on the PPARγ2-promoter-driven luciferase reporter. (I) Oil Red O staining of 10T1/2 cells expressing vector, Foxa3-WT, or Foxa3-DBD mutant at day 6 after induction of adipocyte differentiation. (J) Relative aP2 mRNA levels of 10T1/2 cells expressing vector, Foxa3-WT, or Foxa3-DBD mutant at day 6 of adipocyte differentiation. Data represent means ± SEM (***, P < 0.001; ###, P < 0.001; **, P < 0.01; ns, nonsignificant).
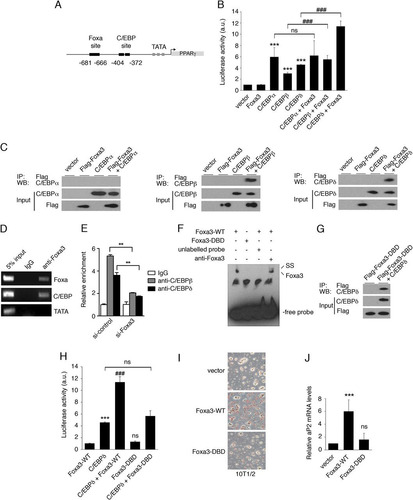
Fig 4 Foxa3-null mice have decreased visceral adiposity but no reduction in inguinal fat depot compared to WT mice. (A) Epididymal (eWAT) and inguinal (iWAT) fat depot morphology of 2-week-old WT and Foxa3-null (KO) mice. (B) Weights of eWAT and iWAT depots of 2-week-old WT (n = 6) and Foxa3-null (KO) (n = 6) mice. B.W., body weight. (C) Relative mRNA levels of adipocyte markers in epididymal (eWAT) and inguinal (iWAT) depots of 2-week-old WT (n = 6) and Foxa3-null (KO) (n = 6) mice. (D) Weights of epididymal (eWAT) and inguinal (iWAT) fat depots in 8-week-old, adult WT (n = 5) and Foxa3-null (KO) (n = 5) mice. (E) Relative mRNA levels of adipocyte markers in epididymal (eWAT) and inguinal (iWAT) depots of 8-week-old WT (n = 5) and Foxa3-null (KO) (n = 5) mice. (F) Body weight of WT (n = 5) and Foxa-null (KO) (n = 5) mice after HFD regimen. (G) Weights of epididymal (eWAT), inguinal (iWAT), mesenteric (mWAT), retroperitoneal (rWAT), and brown fat (BAT) depots in adult WT (n = 5) and Foxa3-null (KO) (n = 5) mice fed a HFD. (H) Hematoxylin and eosin (H&E) staining of epididymal (eWAT) and inguinal (iWAT) fat depots of adult WT and Foxa3-null (KO) mice after HFD regimen. (I) Size measurements of adipocytes in the epididymal and inguinal depots of adult WT (n = 5) and Foxa3-null (KO) (n = 5) mice fed a HFD. (J) Relative mRNA levels of adipocyte differentiation markers in epididymal and inguinal fat depots of adult WT (n = 5) and Foxa3-null (KO) (n = 5) mice after HFD regimen. (K) Relative mRNA levels of adipocyte markers at day 6 after induction of adipocyte differentiation in stromal-vascular fractions (SVF) of cells obtained from visceral (visc) and inguinal (ing) fat depots of WT and Foxa3-null (KO) mice. Data represent means ± SEM (***, P < 0.001; **, P < 0.01; *, P < 0.05).
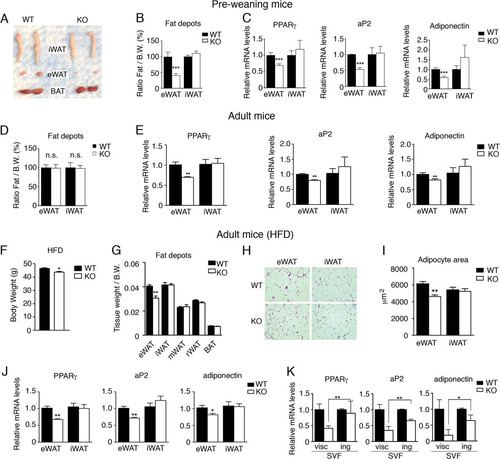
Fig 5 Foxa3 mRNA levels are regulated by a HFD. (A) Relative Foxa3 mRNA levels in fat depots of WT mice fed a normal diet (n = 4) or a HFD (n = 4) for 14 weeks. eWAT, epididymal WAT; iWAT, inguinal WAT; mWAT, mesenteric WAT; rWAT, retroperitoneal WAT; BAT, brown adipose tissue. (B) Foxa3 mRNA levels in SVF of cells and adipocytes obtained from epididymal fat depot of mice fed a normal diet (n = 4) or a HFD (n = 4) for 14 weeks. (C) Human FOXA3 mRNA levels in visceral (VAT) and subcutaneous (SAT) adipose tissues in obese women (n = 14). Data represent means ± SEM (**, P < 0.01).

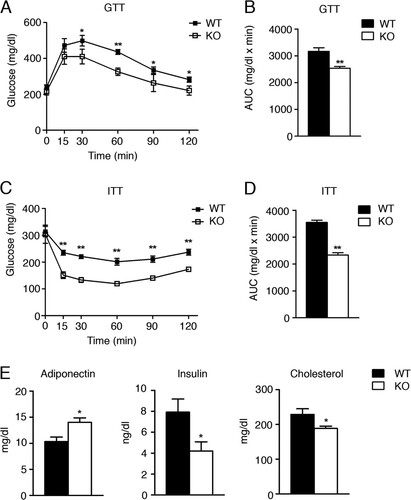
Fig 6 Foxa3-null mice are more insulin sensitive than WT mice. (A to D) GTT (A) and ITT (C) assays in adult WT (n = 5) and Foxa3-null (KO) mice (n = 5) fed a HFD and quantification of area under the curve (AUC) (B and D). (E) Serum parameters in WT (n = 5) and Foxa3-null (KO) mice (n = 5) after HFD regimen. Data represent means ± SEM (**, P < 0.01; *, P < 0.05).