Figures & data
Figure 1 IP LPS injections activate CNS endothelial cells without compromising BBB integrity. (A) Compared to controls, four daily IP LPS injections (1.0 mg/kg) do not increase the fluorescent intensity of NaF transfused from the periphery to the brain. JHMV infection was used as a positive control. (B) Electron micrographs showing endothelial cell TJs in the cortex (TJs; arrowheads) were maintained in LPS-treated mice. N = 3 for PBS-treated mice and N = 4 for LPS-treated mice. (C) The endothelial TJ proteins claudin 5 and occludin were not significantly altered following IP LPS injections. (D) Flow cytometry analysis of CD31-positive brain endothelial cells following IP LPS injections. The gating strategy is shown with the top panels. The endothelial cell activation marker CD54 was significantly increased following four IP LPS injections, while the trend in increased CD105 and TLR4 expression did not reach statistical significance. (E) TLR4 expression in brain cells as examined by single-cell RNA sequencing queried from VascularSingleCells online database. *P < 0.05 by one-way ANOVA.
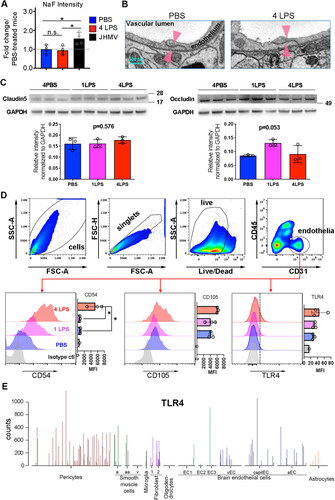
Figure 2 IP LPS injections activate CNS endothelial cells. (A) Microvilli (arrowheads) were examined by EM. (B) 3D-reconstruction of microvilli in the vessel lumen as examined by 3D-EM. (C) Microvilli were significantly increased in LPS-treated mice. (D) Confocal microscopy shows that microglial activation (green) initially occurs in the vicinity of blood vessels (red). Scale bar = 25 μm. Arrowheads indicate the lengths of randomly selected longitudinal blood vessels analyzed for proximal CD31 and F4/80 staining. (E) Fluorescence intensity profiles demonstrate that activated microglia (green) line blood vessels (red). Arrowheads correspond to the arrowheads shown in panel (D). This result represents three independent experiments. Error bars represent SD. *P < 0.05 by Student’s t-test.
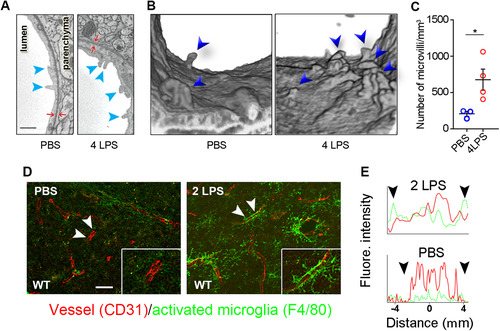
Figure 3 Cxcl10 is highly expressed by activated endothelial cells. (A) Distance matrix of endothelial cell expression data examined by NanoString analysis showing results from a single LPS injection. (B) Unsupervised hierarchical clustering of gene expressions by endothelial cells isolated from single-dose PBS- or LPS-treated mice. (C) Volcano dot plot of NanoString analysis showing that Cxcl10 is the most significantly upregulated transcript expressed by brain endothelial cells after one LPS injection. Transcripts above the dotted line have a P < .05. (D) Fold increases in individual transcripts following one or four LPS injections. *P < .05, ***P < .001 by Student’s t-test. (E) ELISA detected increased CXCL10 in brain extracts after one or four LPS injections. *P < .05, ***P < .001 by one-way ANOVA with Tukey’s post hoc test. N as indicated by individual circles. (F) STRING analysis supports MyD88 as an essential regulator of upregulated genes; Cxcl10 forms networks with other genes of interest. Error bars represent SD.
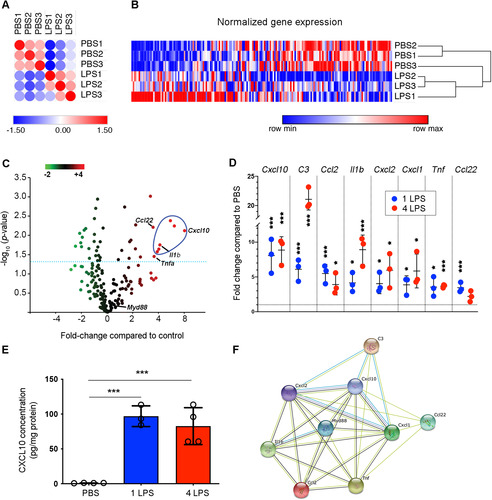
Figure 4 Microglial activation is abolished when MYD88 is selectively deleted from endothelial cells. (A) Contour plots of the cells “before” and “after” FACS sorting. High-purity endothelial cells or microglia were obtained. (B) PCR reaction on FACS-sorted brain endothelial or microglial cells confirmed that the Myd88 gene is specifically and effectively removed from endothelial cells, but not from microglia. DNA gels of end-point PCR products are shown. (C) Brain endothelial Cxcl10 mRNA levels were not significantly increased in Tie2e-Cre+ mice after LPS treatment. Error bars represent SD. *P < .05; one-way ANOVA with Tukey’s post hoc test. N as indicated by individual circles. (D) Micrographs of IBA1 immunohistochemistry stain. Scale bar = 50 μm or 10 μm in the insets. Microglial activation depends upon the presence of endothelial MyD88. (E) Quantification of microglial activation. Error bars represent SD. **P < .01; one-way ANOVA with Tukey’s post hoc test. N as indicated by individual circles.
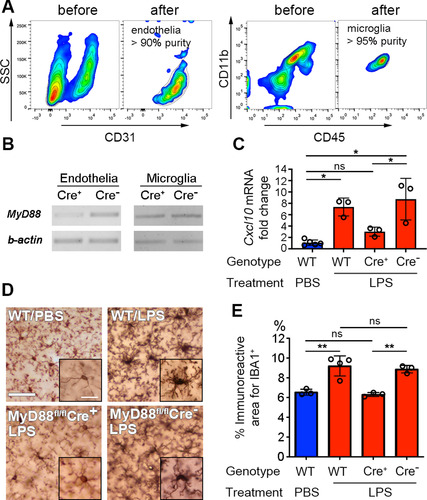
Figure 5 Neuroprotection is diminished in Cxcl10−/− mice. (A) Representative images of cryogenic lesions in WT and Cxcl10−/− mice. Lesions appear as discolored regions and are demarcated by dotted lines. (B) Lesions volumes were reduced in LPS-treated WT mice, but not in LPS-treated Cxcl10−/− mice. Error bars represent SD. *P < .05, one-way ANOVA with Tukey’s post hoc test. (C) Beam-crossing behavior test of WT and Cxcl10−/− mice following brain injury. **P < .01 by two-way ANOVA test. (D) Representative images of microglial activation in PBS- and LPS-treated Cxcl10−/− mice. (E) The percentage of cortical area occupied by microglia was increased in LPS-treated WT mice, but not in LPS-treated Cxcl10−/− mice. **P < .01, one-way ANOVA with Tukey’s post hoc test. N is indicated by individual circles. (F) Confocal micrographs of neurons (red), microglia (blue), and GAD-positive inhibitory synapses (green) in PBS- and LPS-treated Cxcl10−/− mice. The neuronal circumference occupied by GAD-positive synapses was reduced in WT mice, but not in Cxcl10−/− mice. Error bars represent SD. **P < 0.01, one-way ANOVA with Tukey’s post hoc test. N is indicated by individual circles.
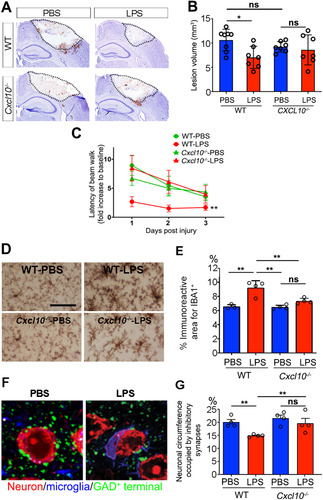
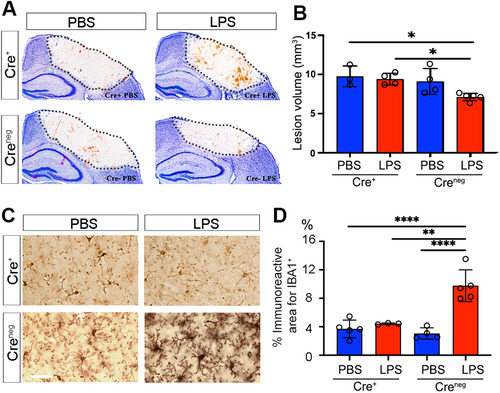
Figure 6 Neuroprotection and microglial activation are abolished when CXCL10 is selectively abolished from brain endothelial cells. (A) Representative images of cryogenic lesions in PBS- and LPS-treated Cre+ and Creneg Cxcl10fl/fl;Tie2eCre mice visualized by Giemsa stain. Lesions appear as discolored regions and are demarcated by dotted lines. (B) Lesion volumes were reduced in LPS-treated Creneg mice, but not in LPS-treated Cre+ mice. Error bars represent SD. *P < .05 by one-way ANOVA with Tukey’s post hoc test. (C) Cortical microglia in PBS-treated and LPS-treated Creneg and Cre+ mice. (D) The percentage of cortical area occupied by microglia was increased in LPS-treated Creneg, but not in LPS-treated Cre+ mice. Error bars represent SD. **P < .01, ****P < .0001, one-way ANOVA with Tukey’s post hoc test. N as indicated by individual circles.