Figures & data
Table 1 Subject Characteristics.
Figure 1 Pathologic deposition of TDP-43 and casein kinase 2 (CK2) immunoreactivity in the basal ganglia of HIV+ individuals. (a,a’ and b,b’) Representative confocal images of TDP-43, casein kinase 1δ (CK1δ), pTDP-43, and CK2 immunofluorescence in HIV− (a,b) and HIV+ (a’,b’) basal ganglia. Note the overall paucity of CK1δ antigenicity and the increased nuclear-to-cytoplasmic redistribution of TDP-43 antigenicity in the neural cells of HIV+ individuals. (c) A high magnification (63×) image showing pTDP-43 and CK2 immunofluorescence colocalization in cells within post-mortem HIV+ basal ganglia.
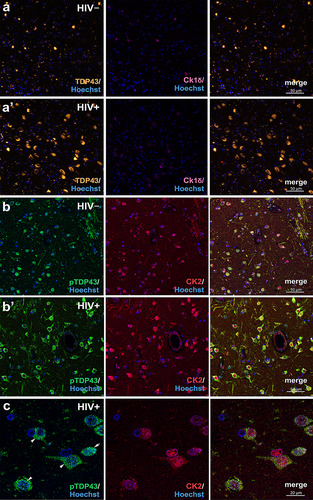
Figure 2 Assessment of pathologic TDP-43 and casein kinase 2 (CK2) immunoreactivity in the basal ganglia of HIV− and HIV+ individuals. (a) Colocalization of pTDP-43, CK2, and DARPP32 immunoreactivity in cells of post-mortem HIV+ brains confirming the identity of the cells as medium spiny neurons. (b,c) Cytoplasmic TDP-43 (b) and pTDP-43 (c) fluorescence intensities were increased in HIV+ compared to HIV− basal ganglia. (d) Cytoplasmic-to-nuclear ratio of TDP-43 fluorescent intensity was increased in HIV+ tissues indicating mislocalization. (e) CK1δ fluorescent intensity was slightly above background levels and not changed in any of the groups evaluated. (f) Cytoplasmic CK2 intensity was increased in HIV+ compared to HIV− basal ganglia. Pearson correlations revealed no significant relationship between the nuclear (g) and cytoplasmic (h) intensities of pTDP-43 (pooled across groups) vs CK1δ fluorescence. On the contrary, nuclear (i) and cytoplasmic (j) intensities of pTDP-43 fluorescence (pooled across groups) correlated positively with CK2 fluorescence intensities. Mean intensity values indicate the mean fluorescence pixel intensities for each respective protein acquired in optical sections using confocal microscopy and analyzed using CellProfilerTM 6.1 software (see Materials and Methods 2.1.2). Data are expressed as the mean + the SEM (n = 4-7/group). * indicates a significant difference by Student’s t-test (p < 0.05).
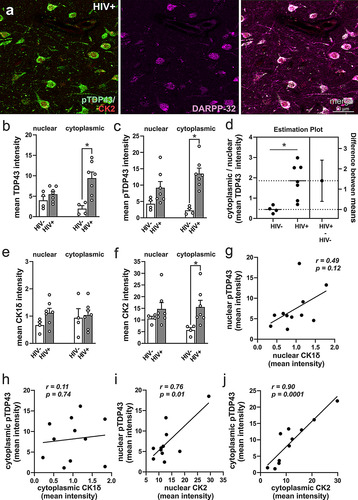
Figure 3 Effects of morphine and Tat on the concentrations of TDP-43 and casein kinases in the mouse striatum. (a) Nuclear TDP-43 levels were not changed in any of the groups evaluated. (a,b) Alternatively, morphine exposure increased cytoplasmic TDP-43 levels (a), and nuclear and cytoplasmic levels of pTDP-43 (b), while Tat increased cytoplasmic pTDP-43 concentrations (b). (b) Post hoc comparisons showed differences in nuclear pTDP-43 between saline-treated (Tat+ and Tat−) mice vs mice co-exposed to Tat and morphine, and in cytoplasmic pTDP-43 levels between saline-treated Tat− mice vs mice co-exposed to Tat and morphine. (c) Representative immunoblots of cytoplasmic pTDP-43, TDP-43, CK1δ, CK2α, and CK2α’, and GAPDH. (d) The cytoplasmic-to-nuclear ratios of TDP-43 levels were not changed in any of the treatment groups. (e) Nuclear and cytoplasmic CK1δ levels were not changed in any of the groups evaluated. (f) When CK2 levels were evaluated, Tat increased nuclear CK2α levels, and either Tat or morphine alone increased cytoplasmic CK2α levels. (f) Post hoc comparisons of cytoplasmic CK2α levels showed differences between saline-treated Tat− mice vs Tat+ mice that were exposed to morphine. (g) Nuclear and cytoplasmic levels of the CK2α’ subunit were unaffected by Tat or morphine exposure. Data are expressed as the mean + the SEM (n = 5-6/group). # indicates significant main effects by two-way ANOVA; * indicates planned contrasts with post hoc Tukey’s test (p < 0.05).
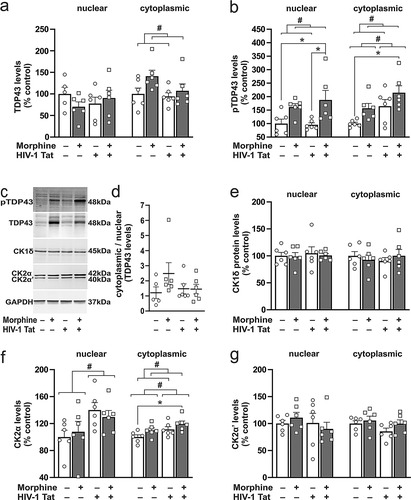
Figure 4 Effects of morphine and Tat on the relationship between the concentrations of pTDP-43 and TDP-43 kinases. (a,b) No significant correlations were observed between levels of nuclear (a) or cytoplasmic (b) CK1δ () and pTDP-43 (). (c) No significant correlations were observed between levels of nuclear CK2α () vs nuclear pTDP-43 (). (d) By contrast, levels of cytoplasmic CK2α () positively correlated with cytoplasmic pTDP-43 () concentrations (p < 0.05). (e,f) No significant correlations were observed between levels of nuclear (e) or cytoplasmic (f) CK2α’ () and pTDP-43 ().
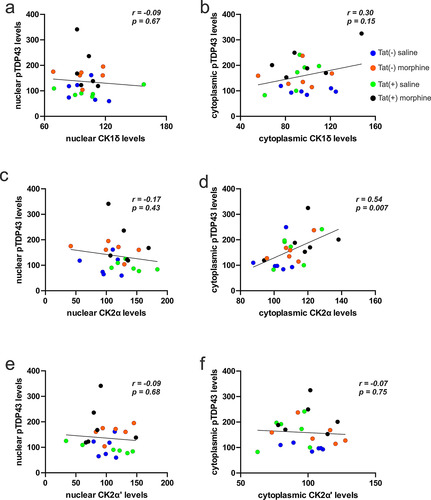
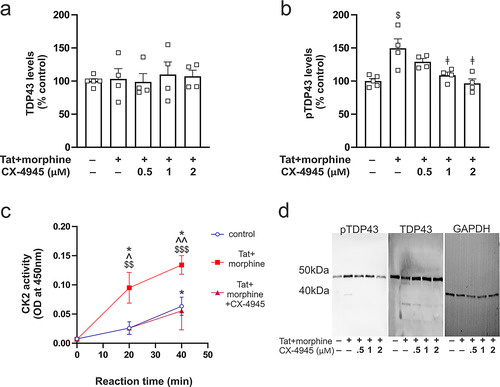
Figure 5 The effects of Tat and morphine on pTDP-43 levels and CK2 activity in striatal neurons in vitro. (a) Tat or morphine exposure did not affect the concentration of cytoplasmic TDP-43. (b) By contrast, Tat and morphine co-exposure significantly increased levels of cytoplasmic pTDP-43, and these increases in pTDP-43 were fully reversible by the CK2 antagonist (CX-4945) in a concentration-dependent manner. (c) Tat and morphine co-exposure increased CK2 enzymatic activity in cytoplasmic extracts of striatal neurons. (d) Representative immunoblots of cytoplasmic pTDP-43, TDP-43, and GAPDH. Symbols indicate planned contrasts with post hoc Tukey’s test (p < 0.05). $ vs the control group (no active treatment), $$ vs the control group at the 20 min reaction time, $$$ vs the control group at 40 min, ǂ vs Tat+/morphine group, ^ vs Tat+/morphine and Cx-4945 at 20 min, ^^ vs Tat+/morphine and Cx-4945 at 40 min, * vs the 0 min reaction time. Data are expressed as the mean + or ± the SEM (n = 4 experiments/group).