
Figures & data
This is a visual representation of the abstract.
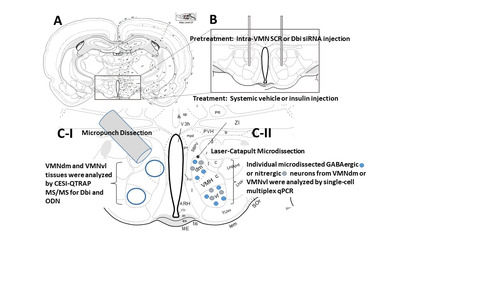
Figure 1 High-performance Capillary Electrophoresis-Electrospray Ionization-Quadrupole-Linear Ion Trap Mass Spectrometry (QTRAP CESI-MS/MS) Quantification of Diazepam Binding Inhibitor (Dbi) and Octadecaneuropeptide (ODN) in Ventromedial Hypothalamic Nucleus (VMN) Dorsomedial (VMNdm) versus Ventrolateral (VMNvl) Divisions. Groups of Dbi or scramble (SCR) siRNA-pretreated male rats (n = 3/group) were sacrificed by microwave fixation 1 h after subcutaneous (sc) injection of vehicle (V) or neutral protamine Hagedorn insulin (INS; 10.0 U/kg bw). VMNvl and VMNdm tissues were each bilaterally micropunch-dissected from 100 micron-thick fresh frozen sections cut from −1.80 to −2.30 mm posterior to bregma, using a hollow 0.50 mm-diameter punch tool, for CESI-QTRAP MS/MS analysis (see the Materials and Methods section). Data depict mean Dbi mRNA [ (VMNdm) and 1D (VMNvl)], Dbi protein [ (VMNdm) and 1E (VMNvl), or ODN protein [ (VMNdm) and 1F (VMNvl)] measures ± S.E.M. following treatment groups: SCR siRNA/V (solid white bars, n = 3), Dbi siRNA/V (diagonal-striped white bars, n = 3), SCR siRNA/INS (solid gray bars, n = 3), and Dbi siRNA/INS (diagonal-striped gray bars, n = 3). Results of statistical analyses are as follows: VMNdm Dbi mRNA: F(3,8): 45.65, p < 0.001; Knockdown main effect: F(1,8): 34.62, p < 0.001; INS main effect: F(1,8): 62.05, p < 0.001; Knockdown/INS interaction: F(1,8): 40.27; p < 0.001; VMNvl Dbi mRNA: F(3,8): 69.86, p < 0.001; Knockdown main effect: F(1,8): 177.75, p < 0.001; INS main effect: F(1,8): 18.45, p = 0.003; Knockdown/INS interaction: F(1,8): 13.38; p = 0.006]; F(3,8): 45.65, p < 0.001, Knockdown main effect: F(1,8): 34.62, p < 0.001; INS main effect: F(1,8): 62.05, p < 0.001; Knockdown/INS interaction: F(1,8): 40.27; p < 0.001]; VMNdm Dbi protein: F(3,8): 4.90, p = 0.032; Knockdown main effect: F(1,8): 0.702, p = 0.426; INS main effect: F(1,8):1.01, p = 0.344; Knockdown/INS interaction: F(1,8): 12.98; p = 0.007]; VMNdm ODN protein: F(3,8): 14.07, p = 0.001, Knockdown main effect: F(1,8): 1.97, p = 0.198; INS main effect: F(1,8): 9.45, p = 0.015; Knockdown/INS interaction: F(1,8): 30.78, p < 0.001; VMNvl Dbi protein: F(3,8): 13.15, p = 0.002, Knockdown main effect: F(1,8): 1.97, p = 0.198; INS main effect: F(1,8): 6.83, p = 0.031; Knockdown/INS interaction: F(1,8): 30.66, p < 0.001; VMNvl ODN protein: F(3,8): 37.87, p < 0.001; Knockdown main effect: F(1,8): 22.29, p = 0.002; INS main effect: F(1,8): 91.27, p < 001; Knockdown/INS interaction: F(1,8): 0.06, p = 0.816]. Statistical differences between discrete pairs of treatment groups are denoted as follows: *p < 0.05; **p < 0.01; and ***p < 0.001.
![Figure 1 High-performance Capillary Electrophoresis-Electrospray Ionization-Quadrupole-Linear Ion Trap Mass Spectrometry (QTRAP CESI-MS/MS) Quantification of Diazepam Binding Inhibitor (Dbi) and Octadecaneuropeptide (ODN) in Ventromedial Hypothalamic Nucleus (VMN) Dorsomedial (VMNdm) versus Ventrolateral (VMNvl) Divisions. Groups of Dbi or scramble (SCR) siRNA-pretreated male rats (n = 3/group) were sacrificed by microwave fixation 1 h after subcutaneous (sc) injection of vehicle (V) or neutral protamine Hagedorn insulin (INS; 10.0 U/kg bw). VMNvl and VMNdm tissues were each bilaterally micropunch-dissected from 100 micron-thick fresh frozen sections cut from −1.80 to −2.30 mm posterior to bregma, using a hollow 0.50 mm-diameter punch tool, for CESI-QTRAP MS/MS analysis (see the Materials and Methods section). Data depict mean Dbi mRNA [Figures 1A (VMNdm) and 1D (VMNvl)], Dbi protein [Figures 1B (VMNdm) and 1E (VMNvl), or ODN protein [Figures 1C (VMNdm) and 1F (VMNvl)] measures ± S.E.M. following treatment groups: SCR siRNA/V (solid white bars, n = 3), Dbi siRNA/V (diagonal-striped white bars, n = 3), SCR siRNA/INS (solid gray bars, n = 3), and Dbi siRNA/INS (diagonal-striped gray bars, n = 3). Results of statistical analyses are as follows: VMNdm Dbi mRNA: F(3,8): 45.65, p < 0.001; Knockdown main effect: F(1,8): 34.62, p < 0.001; INS main effect: F(1,8): 62.05, p < 0.001; Knockdown/INS interaction: F(1,8): 40.27; p < 0.001; VMNvl Dbi mRNA: F(3,8): 69.86, p < 0.001; Knockdown main effect: F(1,8): 177.75, p < 0.001; INS main effect: F(1,8): 18.45, p = 0.003; Knockdown/INS interaction: F(1,8): 13.38; p = 0.006]; F(3,8): 45.65, p < 0.001, Knockdown main effect: F(1,8): 34.62, p < 0.001; INS main effect: F(1,8): 62.05, p < 0.001; Knockdown/INS interaction: F(1,8): 40.27; p < 0.001]; VMNdm Dbi protein: F(3,8): 4.90, p = 0.032; Knockdown main effect: F(1,8): 0.702, p = 0.426; INS main effect: F(1,8):1.01, p = 0.344; Knockdown/INS interaction: F(1,8): 12.98; p = 0.007]; VMNdm ODN protein: F(3,8): 14.07, p = 0.001, Knockdown main effect: F(1,8): 1.97, p = 0.198; INS main effect: F(1,8): 9.45, p = 0.015; Knockdown/INS interaction: F(1,8): 30.78, p < 0.001; VMNvl Dbi protein: F(3,8): 13.15, p = 0.002, Knockdown main effect: F(1,8): 1.97, p = 0.198; INS main effect: F(1,8): 6.83, p = 0.031; Knockdown/INS interaction: F(1,8): 30.66, p < 0.001; VMNvl ODN protein: F(3,8): 37.87, p < 0.001; Knockdown main effect: F(1,8): 22.29, p = 0.002; INS main effect: F(1,8): 91.27, p < 001; Knockdown/INS interaction: F(1,8): 0.06, p = 0.816]. Statistical differences between discrete pairs of treatment groups are denoted as follows: *p < 0.05; **p < 0.01; and ***p < 0.001.](/cms/asset/5794c293-2579-433e-b550-1519aefeaa30/tasn_a_12426813_f0001.jpg)
Figure 2 Effects of Dbi Gene Knockdown on Eu- or Hypoglycemic Neurotransmitter and Metabolic Sensor Marker Gene Expression Patterns in VMNvl γ-Aminobutyric Acid (GABAergic) Neurons. Groups of male rats (n = 4/group) were pretreated by bilateral administration of Dbi or SCR siRNA to the VMN 7 days prior to sc V or INS injection. Individual VMNvl glutamate decarboxylase (Gad)65/67-immunopositive neurons were laser-catapult-microdissected from 10 micron-thick fresh frozen sections for multiplex single-cell qPCR analyses. mRNA data were normalized to the housekeeping gene GAPDH by the 2−ΔΔCt method. Data depict mean normalized Gad1/Gad67 (), Gad2/Gad65 (), glucokinase (Gck; ), glucokinase-regulatory peptide (Gkrp; ), 5’-AMP-activated protein kinase-alpha1 (AMPKα1/Prkaa1; ), or AMPK-alpha2 (AMPKα2/Prkaa2; ) mRNA measures ± S.E.M. for the following treatment groups: SCR siRNA/V (solid white bars, n = 8), Dbi siRNA/V (diagonal-striped white bars, n = 8), SCR siRNA/INS (solid gray bars, n = 8), and Dbi siRNA/INS (diagonal-striped gray bars, n = 8). Outcomes of statistical analyses are as follows: Gad1: F(3,28): 115.48, p < 0.001; Knockdown main effect: F(1,28): 58.82, p < 0.0001; INS main effect: F(1,28): 155.34, p < 0.001; Knockdown/INS interaction: F(1,28): 132.28, p < 0.001; Gad2: F(3,28): 193.99, p < 0.001; Knockdown main effect: F(1,28): 98.60, p < 0.0001; INS main effect: F(1,28): 214.88, p < 0.001; Knockdown/INS interaction: F(1,28): 268.50, p < 0.001; Gck: F(3,28): 1425.23, p < 0.001; Knockdown main effect: F(1,28): 497.17, p < 0.0001; INS main effect: F(12,8): 2786.75, p < 0.001; Knockdown/INS interaction: F(12,8): 991.77, p < 0.001; Gkrp: F(3,28): 248.72, p < 0.001; Knockdown main effect: F(1,28): 182.30, p < 0.0001; INS main effect: F(1,28): 336.03, p < 0.0001; Knockdown/INS interaction: F(1,28): 227.83, p < 0.001]; AMPKα1/Prkaa1: F(3,28): 358.40, p < 0.001; Knockdown main effect: F(1,28): 401.23, p < 0.0001; INS main effect: F(1,28): 316.17, p < 0.001; Knockdown/INS interaction: F(1,28): 357.81, p < 0.001; AMPKα2/Prkaa2: F(3,28): 164.77, p < 0.001, Knockdown main effect: F(1,28): 55.19, p < 0.0001; INS main effect: F(1,28): 6.39, p = 0.017; Knockdown/INS interaction: F(1,28): 432.73, p < 0.001]. Statistical differences between discrete pairs of treatment groups are denoted as follows: *p < 0.05; **p < 0.01; and ***p < 0.001.
![Figure 2 Effects of Dbi Gene Knockdown on Eu- or Hypoglycemic Neurotransmitter and Metabolic Sensor Marker Gene Expression Patterns in VMNvl γ-Aminobutyric Acid (GABAergic) Neurons. Groups of male rats (n = 4/group) were pretreated by bilateral administration of Dbi or SCR siRNA to the VMN 7 days prior to sc V or INS injection. Individual VMNvl glutamate decarboxylase (Gad)65/67-immunopositive neurons were laser-catapult-microdissected from 10 micron-thick fresh frozen sections for multiplex single-cell qPCR analyses. mRNA data were normalized to the housekeeping gene GAPDH by the 2−ΔΔCt method. Data depict mean normalized Gad1/Gad67 (Figure 2A), Gad2/Gad65 (Figure 2B), glucokinase (Gck; Figure 2C), glucokinase-regulatory peptide (Gkrp; Figure 2D), 5’-AMP-activated protein kinase-alpha1 (AMPKα1/Prkaa1; Figure 2E), or AMPK-alpha2 (AMPKα2/Prkaa2; Figure 2F) mRNA measures ± S.E.M. for the following treatment groups: SCR siRNA/V (solid white bars, n = 8), Dbi siRNA/V (diagonal-striped white bars, n = 8), SCR siRNA/INS (solid gray bars, n = 8), and Dbi siRNA/INS (diagonal-striped gray bars, n = 8). Outcomes of statistical analyses are as follows: Gad1: F(3,28): 115.48, p < 0.001; Knockdown main effect: F(1,28): 58.82, p < 0.0001; INS main effect: F(1,28): 155.34, p < 0.001; Knockdown/INS interaction: F(1,28): 132.28, p < 0.001; Gad2: F(3,28): 193.99, p < 0.001; Knockdown main effect: F(1,28): 98.60, p < 0.0001; INS main effect: F(1,28): 214.88, p < 0.001; Knockdown/INS interaction: F(1,28): 268.50, p < 0.001; Gck: F(3,28): 1425.23, p < 0.001; Knockdown main effect: F(1,28): 497.17, p < 0.0001; INS main effect: F(12,8): 2786.75, p < 0.001; Knockdown/INS interaction: F(12,8): 991.77, p < 0.001; Gkrp: F(3,28): 248.72, p < 0.001; Knockdown main effect: F(1,28): 182.30, p < 0.0001; INS main effect: F(1,28): 336.03, p < 0.0001; Knockdown/INS interaction: F(1,28): 227.83, p < 0.001]; AMPKα1/Prkaa1: F(3,28): 358.40, p < 0.001; Knockdown main effect: F(1,28): 401.23, p < 0.0001; INS main effect: F(1,28): 316.17, p < 0.001; Knockdown/INS interaction: F(1,28): 357.81, p < 0.001; AMPKα2/Prkaa2: F(3,28): 164.77, p < 0.001, Knockdown main effect: F(1,28): 55.19, p < 0.0001; INS main effect: F(1,28): 6.39, p = 0.017; Knockdown/INS interaction: F(1,28): 432.73, p < 0.001]. Statistical differences between discrete pairs of treatment groups are denoted as follows: *p < 0.05; **p < 0.01; and ***p < 0.001.](/cms/asset/152cbf69-0297-403e-a76a-3862f3f42519/tasn_a_12426813_f0002.jpg)
Figure 3 VMNdm GABAergic Nerve Cell Neurotransmitter and Metabolic Sensor Marker Gene Expression during Eu- versus Hypoglycemia; Effects of Dbi Gene Knockdown. Experimental design, treatment group designations, target gene profiles, analytical and statistical methods, and data presentation format are identical to those described in above, except that GAD-immunopositive neurons were laser-catapult-microdissected from the VMNdm. Outcomes of statistical analyses are as follows: Gad1: F(3,28): 35.44, p < 0.001; Knockdown main effect: F(1,28): 21.68, p < 0.0001; INS main effect: F(1,28): 26.88, p < 0.0001; Knockdown/INS interaction: F(1,28): 57.77; p < 0.001]; Gad2: F(32,8): 28.17, p < 0.001, Knockdown main effect: F(1,28): 22.09, p < 0.0001; INS main effect: F(1,28): 56.50, p < 0.0001; Knockdown/INS interaction: F(1,28): 5.91, p = 0.022]; Gck: F(3,28): 45.97, p < 0.001; Knockdown main effect: F(1,8): 56.53, p < 0.0001; INS main effect: F(1,28): 40.52, p < 0.001; Knockdown/INS interaction: F(1,28): 40.84, p < 0.001]; Gkrp: F(3,28): 11.19, p < 0.001; Knockdown main effect: F(1,28): 13.58, p = 0.001; INS main effect: F(1,28): 13.78, p = 0.001; Knockdown/INS interaction: F(1,28): 5.99, p = 0.021]; AMPKα1/Prkaa1: F(3,28): 145.46, p < 0.001, Knockdown main effect: F(1,28): 123.46, p < 0.0001; INS main effect: F(1,28): 143.73, p < 0.00; Knockdown/INS interaction: F(1,28): 169.21, p < 0.001]; AMPKα2/Prkaa2: F(3,28): 84.67, p < 0.001; Knockdown main effect: F(1,28): 71.92; p < 0.0001; INS main effect: F(1,28): 32.30; p < 0.001; Knockdown/INS interaction: F(1,28): 149.78; p < 0.001]. *p < 0.05; **p < 0.01; and ***p < 0.001.
![Figure 3 VMNdm GABAergic Nerve Cell Neurotransmitter and Metabolic Sensor Marker Gene Expression during Eu- versus Hypoglycemia; Effects of Dbi Gene Knockdown. Experimental design, treatment group designations, target gene profiles, analytical and statistical methods, and data presentation format are identical to those described in Figure 2 above, except that GAD-immunopositive neurons were laser-catapult-microdissected from the VMNdm. Outcomes of statistical analyses are as follows: Gad1: F(3,28): 35.44, p < 0.001; Knockdown main effect: F(1,28): 21.68, p < 0.0001; INS main effect: F(1,28): 26.88, p < 0.0001; Knockdown/INS interaction: F(1,28): 57.77; p < 0.001]; Gad2: F(32,8): 28.17, p < 0.001, Knockdown main effect: F(1,28): 22.09, p < 0.0001; INS main effect: F(1,28): 56.50, p < 0.0001; Knockdown/INS interaction: F(1,28): 5.91, p = 0.022]; Gck: F(3,28): 45.97, p < 0.001; Knockdown main effect: F(1,8): 56.53, p < 0.0001; INS main effect: F(1,28): 40.52, p < 0.001; Knockdown/INS interaction: F(1,28): 40.84, p < 0.001]; Gkrp: F(3,28): 11.19, p < 0.001; Knockdown main effect: F(1,28): 13.58, p = 0.001; INS main effect: F(1,28): 13.78, p = 0.001; Knockdown/INS interaction: F(1,28): 5.99, p = 0.021]; AMPKα1/Prkaa1: F(3,28): 145.46, p < 0.001, Knockdown main effect: F(1,28): 123.46, p < 0.0001; INS main effect: F(1,28): 143.73, p < 0.00; Knockdown/INS interaction: F(1,28): 169.21, p < 0.001]; AMPKα2/Prkaa2: F(3,28): 84.67, p < 0.001; Knockdown main effect: F(1,28): 71.92; p < 0.0001; INS main effect: F(1,28): 32.30; p < 0.001; Knockdown/INS interaction: F(1,28): 149.78; p < 0.001]. *p < 0.05; **p < 0.01; and ***p < 0.001.](/cms/asset/6111085c-70e9-436a-b09b-34d64542b98c/tasn_a_12426813_f0003.jpg)
Figure 4 Effects of Dbi Gene Silencing on Eu- or Hypoglycemic Neurotransmitter and Metabolic Sensor Marker Gene Expression Patterns in VMNvl Nitrergic Neurons. Groups (n = 4/group) of Dbi or SCR siRNA-pretreated, V- or INS-injected male rats were sacrificed one hour after sc injection. Individual VMNdm neuronal nitric oxide synthase (nNOS/NOS1)-immunopositive neurons were laser-catapult-microdissected from 10 micron-thick fresh frozen sections for multiplex single-cell qPCR analyses. Data depict mean normalized nNOS/NOS1 (), Gck (), Gkrp (), AMPKα1/Prkaa1 (), or AMPKα2/Prkaa2 () mRNA measures ± S.E.M. for SCR siRNA/V (n = 8), Dbi siRNA/V (n = 8), SCR siRNA/INS (n = 8), Dbi siRNA/INS (n = 8) treatment groups. Outcomes of statistical analyses are as follows: nNOS: F(3,28): 365.90, p < 0.001; Knockdown main effect: F(1,28): 337.27, p < 0.0001; INS main effect: F(1,28): 483.78; p < 0.001; Knockdown/INS interaction: F(1,28): 276.65; p < 0.001; Gck: F(3,28): 328.81, p < 0.001; Knockdown main effect: F(1,28): 822.64, p < 0.0001; INS main effect: F(1,28): 7.36, p = 0.011; Knockdown/INS interaction: F(1,28): 156.42, p < 0.001; Gkrp: F(3,28): 93.08, p < 0.001; Knockdown main effect: F(1,28): 173.19, p < 0.001; INS main effect: F(1,28): 92.90, p < 0.001; Knockdown/INS interaction: F(1,28): 13.14, p = 0.001; AMPKα1/Prkaa1: F(3,28): 122.73, p < 0.001; Knockdown main effect: F(1,28): 24.09, p < 0.0001; INS main effect: F(1,28): 218.50, p < 0.001; Knockdown/INS interaction: F(1,28): 125.60, p < 0.001; AMPKα2/Prkaa2: F(3,28): 160.07, p < 0.001, Knockdown main effect: F(1,28): 168.68, p < 0.0001; INS main effect: F(1,28): 121.08, p < 0.001; Knockdown/INS interaction: F(1,28): 190.44, p < 0.001. Statistical differences between discrete pairs of treatment groups are denoted as follows: *p < 0.05; **p < 0.01; and ***p < 0.001.
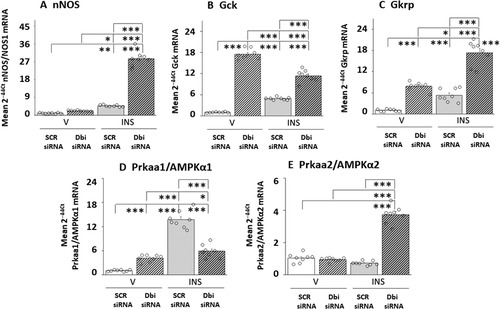
Figure 5 Eu- versus Hypoglycemic Neurotransmitter and Metabolic Sensor Marker Gene Expression Patterns in VMNdm Nitrergic Neurons: Effects of Dbi Gene Knockdown. Experimental design, treatment group designations, target gene profiles, analytical and statistical methods, and data presentation format are identical to that described in above, except that nNOS-immunopositive neurons were laser-catapult-microdissected from the VMNdm. Outcomes of statistical analyses are as follows: nNOS: F(3,28): 78.52, p < 0.001; Knockdown main effect: F(1,28): 65.83, p < 0.0001; INS main effect: F(1,28): 526.22, p < 0,001; Knockdown/INS interaction: F(1,28): 113.52, p < 0.001; Gck: F(3,28): 859.64, p < 0.001; Knockdown main effect: F(1,28): 531.39, p < 0.0001; INS main effect: F(1,28): 1197.25, p < 0.001; Knockdown/INS interaction: F(1,28): 850.27, p < 0.001; Gkrp: F(3,28): 14.82, p < 0.001; Knockdown main effect: F(1,28): 1.04, p = 0.317; INS main effect: F(1,28):4.44, p = 0.044; Knockdown/INS interaction: F(1,28): 38.99, p < 0.001; AMPKα1/Prkaa1: F(3,28): 39.14, p < 0.001; Knockdown main effect: F(1,28): 14.03, p = 0.001; INS main effect: F(1,28): 20.78, p < 0,001; Knockdown/INS interaction: F(1,28): 82.60, p < 0.001; AMPKα2/Prkaa2: F(3,28): 88.86, p < 0.001; Knockdown main effect: F(1,28): 46.27, p < 0.0001; INS main effect: F(1,28): 183.48, p < 0.001; Knockdown/INS interaction: F(1,28): 36.81, p < 0.001. *p < 0.05, **p < 0.01, and ***p < 0.001.
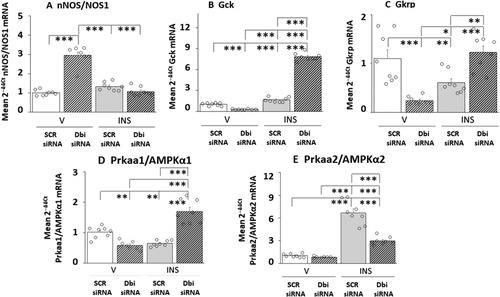
Figure 6 Effects of VMN Dbi Gene Silencing on Plasma Glucose and CounterRegulatory Hormone Profiles in Eu- or Hypoglycemic Male Rats. Plasma samples were obtained from groups of Dbi or SCR siRNA-pretreated male rats one hour after sc injection of V or INS, and analyzed for glucose (), glucagon (), or corticosterone () concentrations. In each panel, individual treatment group data depict mean concentrations ± S.E.M. for n = 4 samples. Data were analyzed by two-way ANOVA and Student–Newman–Keuls post-hoc test, using GraphPad Prism, Vol. 8 software. Results of statistical analyses are as follows: glucose: F(3,12): 170.27, p < 0.001; Knockdown main effect: F(1,8): 1.18, p = 0.299; INS main effect: F(1,12): 485.76, p < 0.001; Knockdown/INS interaction: F(1,12): 23.87, p < 0.001; glucagon: F(3,12): 34.66, p < 0.001; Knockdown main effect: F(1,8): 0.51, p = 0.489; INS main effect: F(1,12): 102.85, p < 0.001; Knockdown/INS interaction: F(1,12): 0.61, p = 0.450; corticosterone: F(3,12): 147.23, p < 0.001; Knockdown main effect: F(1,12): 0.19, p = 0.671; INS main effect: F(1,12): 359.18, p < 0.001; Knockdown/INS interaction: F(1,12): 82.33, p < 0.001. *p < 0.05, **p < 0.01, and ***p < 0.001.
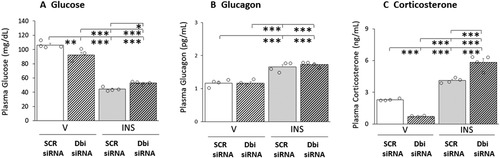
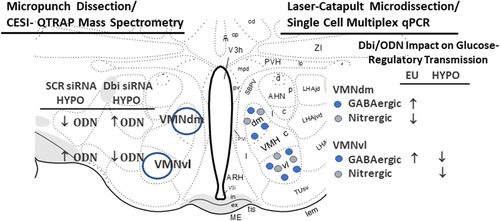
Figure 7 Summary of Outcomes of CESI-QTRAP MS/MS and Single Cell Multiplex qPCR Analysis Analyses of VMN tissue or Laser-Catapult-Microdissected Glucose-Regulatory Neurons. The left side of the cartoon illustrates the effects of Dbi gene knockdown on VMNdm versus the VMNvl ODN tissue content during insulin-induced hypoglycemia (HYPO). The right side depicts the effects of Dbi/ODN signaling on euglycemic (EU) versus HYPO patterns of transmitter marker gene expression in GABAergic or nitrergic neurons laser-microdissected from the VMNdm or VMNvl.
sj-tif-1-asn-10.1177_17590914231214116 - Supplemental material for Diazepam Binding Inhibitor Control of Eu- and Hypoglycemic Patterns of Ventromedial Hypothalamic Nucleus Glucose-Regulatory Signaling
Download TIFF Image (185.4 KB)Data Availability
The data that support the findings of this study are available from the corresponding author upon reasonable request.