Figures & data
Figure 1. Inhibition of BCL11B expression in Molt-4 cells by RNA interference. Alexa Red Oligo transfected Molt-4 cells (A) and MOCK transfected Molt-4 cells used as control (B) at 10 hours after transfection measured by fluorescence microscope (magnification, ×200) and FCM (positive cells are shown as the P3 domain). (C) Suppression of BCL11B mRNA expression measured by qRT-PCR after nucleofection with BCL11B siRNAs (3 μg), compared with expression in cells treated with control non-silencing RNA. Beta-2-MG: beta-2-microglobulin (reference gene). (D) BCL11B protein level in Molt-4 cells at 72 hours after nucleofection with BCL11B siRNAs (3 μg). Non-treated cells (nc), mock-transfected (mock), and scrambled non-silencing RNA (sc)-treated cells were used as controls.
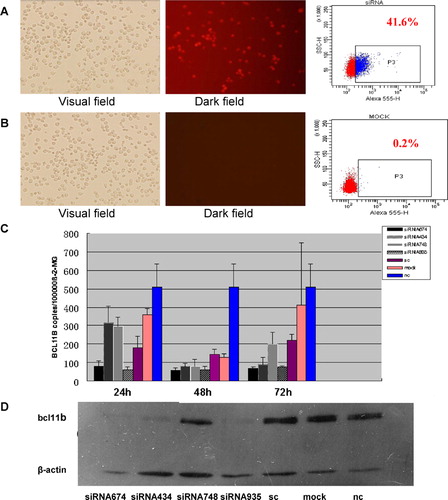
Figure 2. Inhibition of BCL11B expression in primary leukemic cells from four patients (from P1 to P4) by RNA interference using BCL11B-935-siRNA.
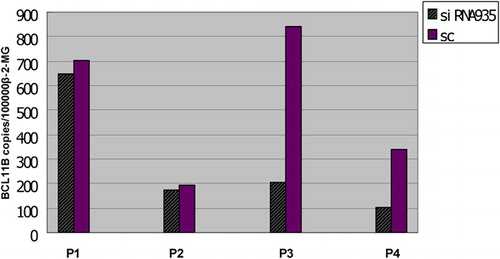
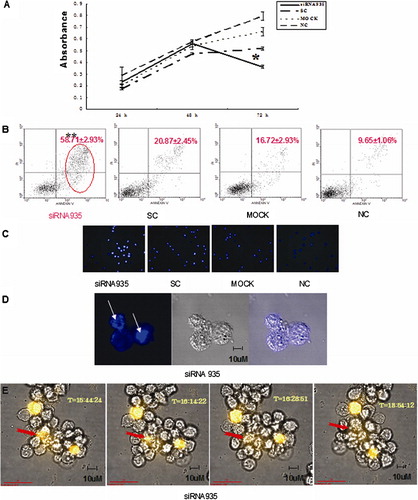
Figure 3. Biological consequences of BCL11B silencing. (A) Absorbances of BCL11B siRNA935-treated and control cells at different time points, as measured by the CCK-8 method. Results represent mean values of three independent experiments. *P<0·05, compared with scrambled non-silencing RNA-treated cells. (B) Induction of apoptosis by BCL11B suppression in Molt-4 cells 72 hours after nucleofection with BCL11B-935-siRNA (3 μg). **P<0·05, compared with control non-silencing RNA-treated cells. (C) Hoechst 33258-stained Molt-4 nuclei at 72 hours after transfected in siRNA935 group were mostly dense stain, showing white color, while the normal nuclei in control groups showed light blue with fluorescence microscope. Magnification, ×100. (D) Laser scanning confocal microscopy further revealed morphological changes of apoptosis with white arrows in siRNA935 group. Magnification, ×630. (E) High-resolution live-cell imaging of Molt-4 cells transfected with BCL11B-935-siRNA and Alexa Red Oligo showed changes over time from 48 to 72 hours. The red arrow denoted Molt-4 cell revealed the process of apoptosis as irregular shape changes, shrinking of volume, and then condensation of apoptosis with fluorescence quenching. Magnification, ×630.