Figures & data
Figure 1. Rational design of a catalytically inactive SOD3 protein. (A) Left, cartoon schematic depicting tetrameric structure of SOD3 (Adapted from PDB ID: 2JLP). Blue = beta sheets; green = alpha helicies; purple = linker regions; red = all non-peptide components. Right, cartoon representation and magnification of active site. Residues targeted for mutation are indicated. Red ball = zinc atom; green balls = copper atoms; blue balls = superoxide molecule. (B) Sequence identification and validation of point mutations for each SOD3 mutant construct. Red boxes indicate DNA codons, while other colors correspond to respective amino acid residue in part (A).
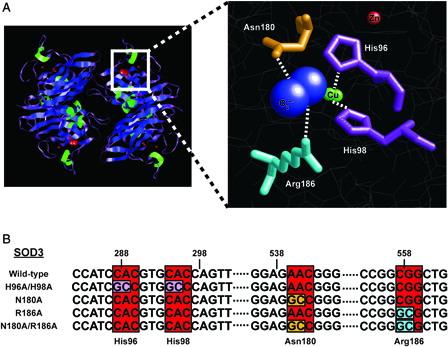
Figure 2. Characterization of the over-expression of the SOD3 mutant constructs. Upper, quantitative real-time RT-PCR analysis of RNA extracted from HEK293 cells transfected with SOD3 mutant constructs for 48 hours. Data normalized to 18 seconds loading control, then to mock transfected by ΔΔCT method. Data represent three biological replicates and are shown as mean and s.d. Where applicable, *P < 0.01 by Student's t-test versus mock-transfected. Lower, western blot analysis of extracellular (EC – from media) or intracellular (IC – from cells) SOD3 protein from HEK293 cells transfected with SOD3 mutant constructs for 48 hours. β-Tubulin shown for loading control.
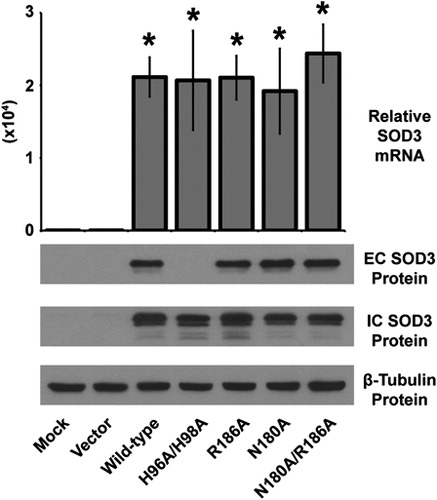
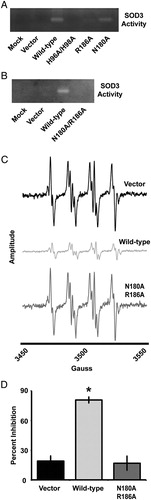
Figure 3. The N180A/R186A mutant SOD3 demonstrates undetectable catalytic activity. (A and B) NBT reduction native gel electrophoresis assay for SOD3 on conditioned media from HEK293 cells transfected with SOD3 mutant constructs for 48 hours. (C) EPR spectra of the DMPO-OH adduct in the presence of the xanthine/xanthine oxidase superoxide-generating system. Each spectrum represents the system in the presence of conditioned media from HEK293 cells transfected with the respective SOD3 construct for 48 hours. All spectra are normalized to the same scale, and amplitude recorded in arbitrary units. (D) Quantification of a WST-1-based spectrophotometric SOD activity assay performed on conditioned media from HEK293 cells transfected with the respective SOD3 construct for 48 hours. Data demonstrate relative inhibition of xanthine/xanthine oxidase superoxide production. Data represent three biological replicates and are shown as mean and s.d. Where applicable, *P < 0.01 by Student's t-test versus vector-transfected.