Figures & data
Figure 1. Schematic representation of experimental procedure.
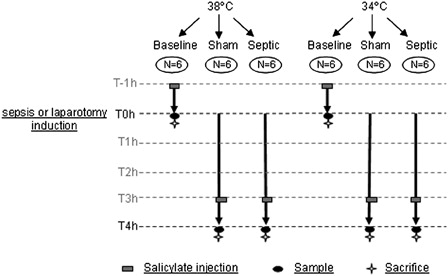
Figure 2. Cytokines values (A, IL-6 and B, TNF-α) in plasma for each experimental condition (n = 6 for each group except for septic group in normothermia where n = 4). Data are expressed as median ± interquartile range. *Significant difference between septic and sham normothermia groups. #Significant difference between septic and sham hypothermia groups. +Significant difference between septic normothermia and septic hypothermia groups (P < 0.05).
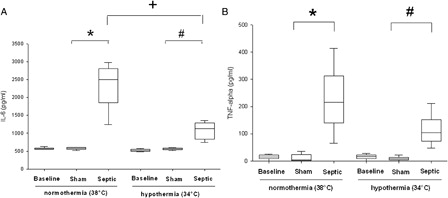
Figure 3. Nitric oxide (NO) level in plasma for each experimental condition (n = 6 for each group except for septic group in normothermia where n = 4 and for sham and septic groups in induced mild hypothermia where n = 5). *Significant difference between septic and sham normothermia groups (P < 0.05). xSignificant difference between sham normothermia and sham hypothermia groups (P < 0.05).
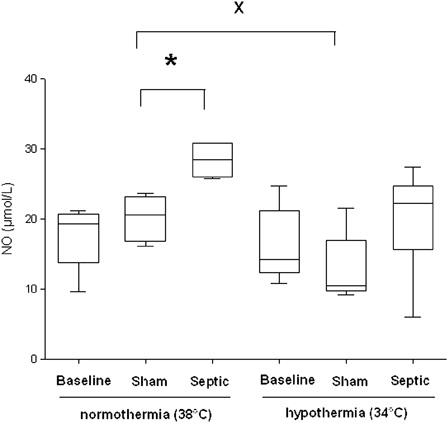
Figure 4. Hydroxyl radical (HO•) production in plasma per hour for each experimental condition (n = 6 for each group except for sham and septic groups in normothermia where n = 5 and n = 4, respectively). Data are expressed as median ± interquartile range *Significant difference between septic and sham normothermia groups. #Significant difference between septic and sham hypothermia groups (P < 0.05).
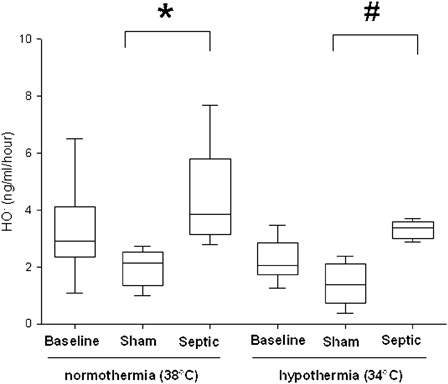
Table 1. SOD and CAT activity and MDA concentrations in the heart for each experimental condition