
Figures & data
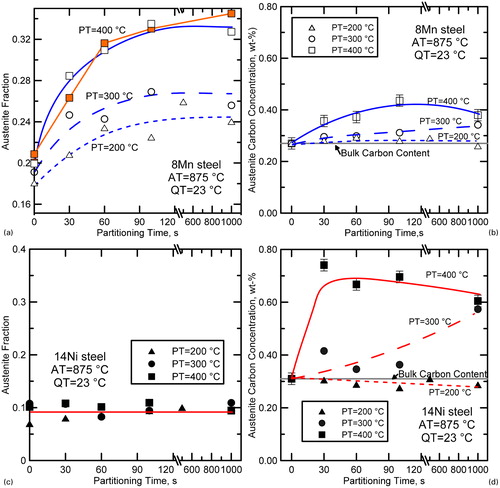
1. XRD results as a function of partitioning time. a, c Austenite fractions for 8Mn and 14Ni steel respectively. b, d Austenite carbon contents for 8Mn and 14Ni steel respectively. With exception of the closed symbols in a, all data were collected from unique samples subjected to partitioning treatments for the times and temperatures indicated. The closed symbols in a were collected from a single sample that was heat-treated cumulatively for the indicated time at 400°C
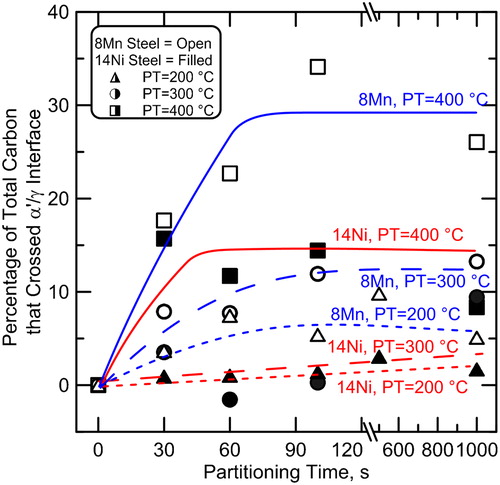
2. Percentage of total carbon that crossed the martensite/austenite interface as a function of partitioning time based on carbon mass balance using XRD data from . Values were calculated by dividing the number (or weight) of carbon atoms that crossed the interface during the partitioning treatment by the total number (or weight) of carbon atoms in the system
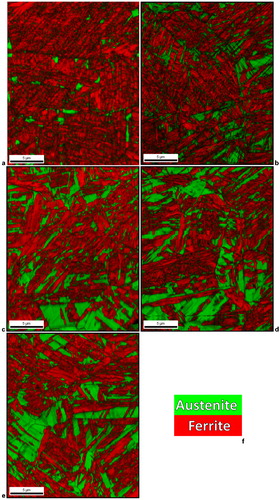
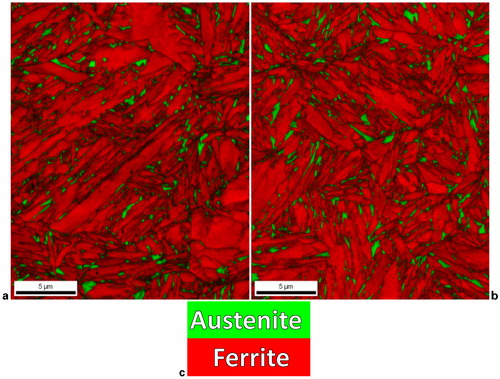
3. a 8Mn steel 875°C+WQ (as quenched); b 8Mn steel 875°C+WQ+400°C, 30 s; c 8Mn steel 875°C+WQ+400°C, 60 s; d 8Mn steel 875°C+WQ+400°C, 100 s; e 8Mn steel 875°C+WQ+400°C, 1000 s; f legend
EBSD image quality+phase maps of 8Mn steel: a as quenched; then partitioned at 400°C for b 30 s, c 60 s, d 100 s, e 1000 s; f legend
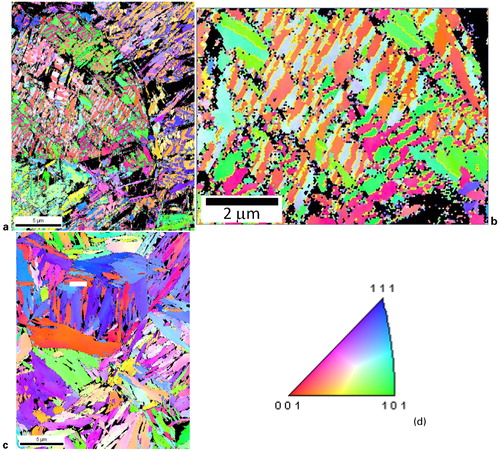
4. a 8Mn steel 875°C+WQ (as quenched); b 8Mn steel 875°C+WQ+400°C, 30 s; c 8Mn steel 875°C+WQ+400°C, 60 s; d 8Mn steel 875°C+WQ+400°C, 100 s; e 8Mn steel 875°C+WQ+400°C, 1000 s; f legend
Inverse pole figure maps of austenite in 8Mn steel: a as quenched, partitioned at 400°C for b 30 s, c 60 s, d 100 s, e 1000 s; f legend. Regions that indexed as martensite regions appear black
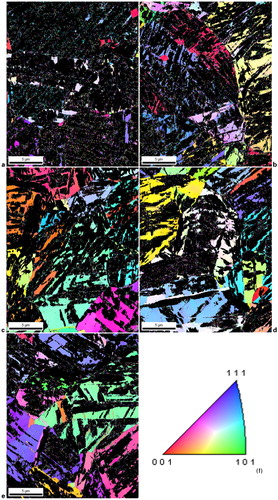
Table 1. Number of distinct austenite crystals present in 8Mn steel in 20×25 μm area measured by EBSD after partitioning at 400°C for times indicated
5. a 14Ni steel 875°C+WQ (as quenched); b 14Ni steel 875°C+WQ+400°C, 100 s; c legend
EBSD image quality+phase maps of 14Ni steel after a water quenching and b water quenching and partitioning at 400°C for 100 s
6. a 8Mn steel 875°C+WQ+400°C, 30 s; b 8Mn steel 875°C+WQ+400°C, 30 s; c 14Ni steel 875°C+WQ+400°C, 30 s; d legend
Representative inverse pole figure map of ferrite/martensite in a 8Mn steel and c 14Ni steel. Samples were partitioned at 400°C for 30 s. b Higher magnification image of that shown in a where yellow highlighting shows all boundaries that represent a 60° rotation about a <111>α axis. These boundaries were found in all conditions of the 8Mn steel
7. Representative EBSD. Image quality maps (greyscale) with austenite highlighted in green and martensite/austenite boundaries that exhibit particular orientation relationships highlighted in red (KS OR) or yellow (NW OR). Samples were partitioned at 400°C for 60 s
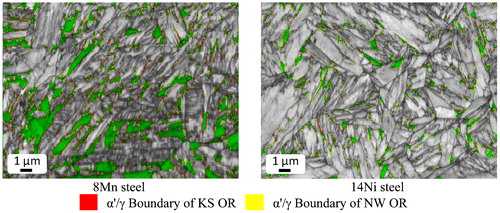
Table 2. Orientation relationships and associated axis–angle pairsCitation28
Table 3. Length of boundaries associated with KS or NW orientation relationships analysed by EBSD