
Figures & data
Table 1. Current infant and young child feeding recommendations in CambodiaCitation23
Table 2. Scoring system for child feeding index by age group
Table 3. Selected household characteristics, WHO IYCF indicators and child nutritional status
Table 4. Child feeding index (CFI) components by CFI age-group
Figure 1. Mean (SD) LAZ per 2-months age-group (n = 798). (The error bars show −1 SD of the mean).
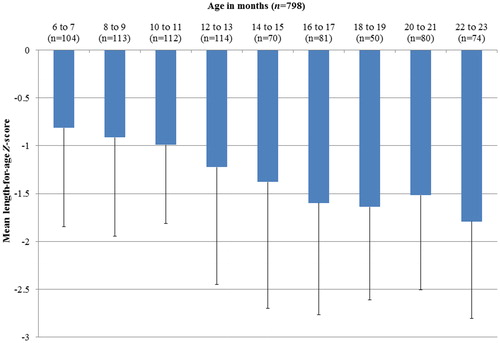
Table 5. Associations of WHO IYFC indicators and LAZ - results from independent sample t-test
Table 6. Bivariate correlations between CFI components and LAZ by age group
Figure 2. Estimated marginal means of LAZ scores by CFI scores. No. of cases: CFI 1 = 1, CFI 2 = 7, CFI 3 = 25, CFI 4 = 35, CFI 5 = 105, CFI 6 = 201, CFI 7 = 189, CFI 8 = 106, CFI 9 = 83, CFI 10 = 45.
* Covariates appearing in the model are evaluated at the following values: CFI, CFIsq, age (days), household members aged <2 years, education respondent (years of schooling), household’s wealth index, age of mother, height (cm) of mother, BMI of mother, sex of child; ** CFI score 1 represents one case only, thus the estimation might be biased. (See in supplementary material for the exact value of the estimated marginal means, standard error and 95% confidence intervals, www.maneyonline.com/doi/suppl/10.1179/2046905514Y.0000000155.)
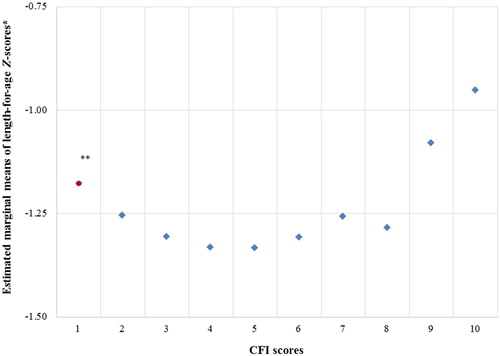
Table 7. Linear model of predictors of LAZ disaggregated into CFI1–4 and CFI5–10