
Figures & data
Table 1. Participant information, including age, educational level and performance on all tasks
Figure 1. Average pure tone thresholds at 0.25, 0.5, 1, 2, 4, and 8 kHz for both ears (n = 96). Error bars represent one standard deviation of the mean.
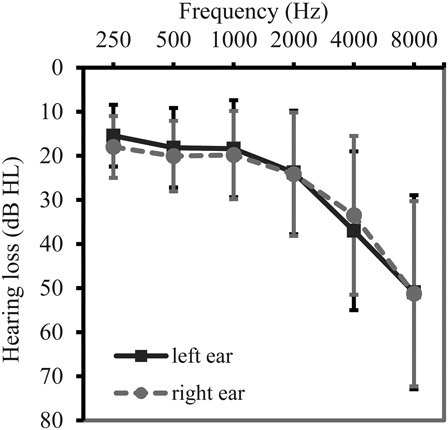
Table 2. Mean discrimination performance per stimulus length and subtest
Table 3. Pearson's correlation coefficients (and corresponding p values) between auditory, cognitive, and linguistic measures (n = 96)
Table 4. Summary of principal factor analysis after varimax rotation (n = 96)
Table 5. Statistical models for discrimination accuracy as a function of subtest and stimulus length*
Table 6. Statistical models for the response times as a function of subtest and stimulus length*