Figures & data
Figure 1. FT-IR spectra of a IIR and b MA-g-IIR
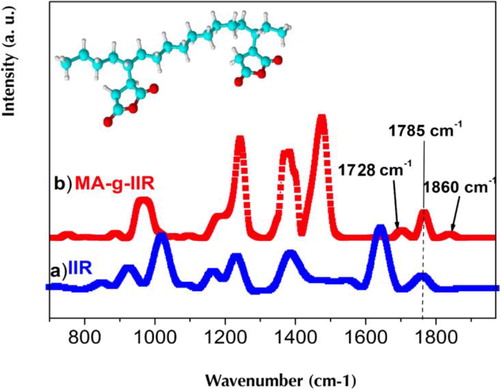
Table 1. Details of samples used
Figure 2. Schematic representation the measurement cell in which QRS are implemented
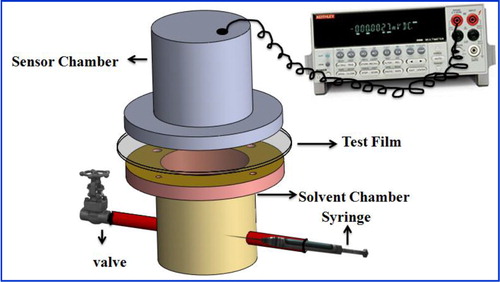
Figure 3. Typical chemo-resistive response of QRS when exposed to toluene molecules with and without IIR filmCitation16
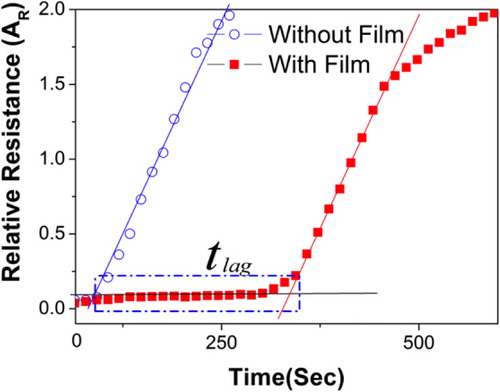
Figure 4. Atomic force microscopy (AFM) images of GO platelets deposited on an oxidized smooth silica surface
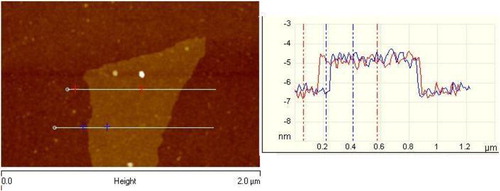
Figure 5. WAXD patterns of a EG, RGO, IIR-EG, and IIR-RGO (insight shows closed view) and b Cloisite10A, IIR-Cloisite10A, and MA-g-IIR-Cloisite10A
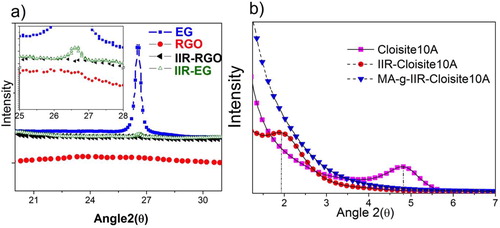
Figure 6. Transmission electron microscopy (TEM) photographs of a IIR and b MA-g-IIR filled with 1.12 v/v% of cloisite 10A
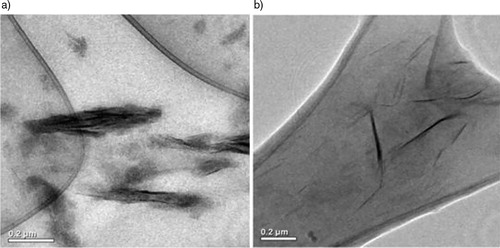
Figure 7. SEM of a RGO, b IIR-RGO, and c IIR-EG
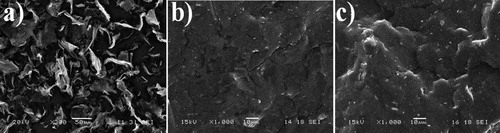
Figure 8. Evolution of PC-1%CNT (w/w), PCL-1%CNT (w/w), and neat CNT (1%w/w) QRS response with toluene vapor concentration in ppm
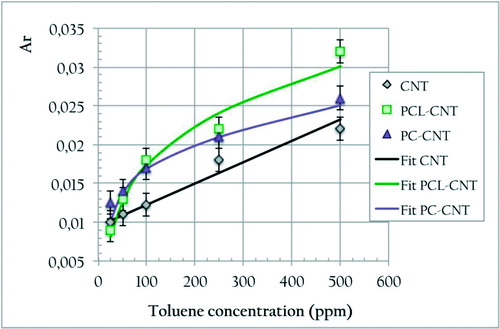
Table 2. Parameter obtained after fitting with the Langmuir–Henry Clustering (LHC) model expressed by equations (6) and (7)
Table 3. Diffusion coefficients of toluene vapor through IIR-based nanocomposites
Figure 9. Decrease in diffusion coefficient (cm2 s− 1) and increase in diffusion coefficient reduction of toluene in IIR, IIR-2.92%v/v Cloisite, MA-g-IIR-2.92%v/v Cloisite, and IIR-2.43%v/vRGO composites (from left to right)
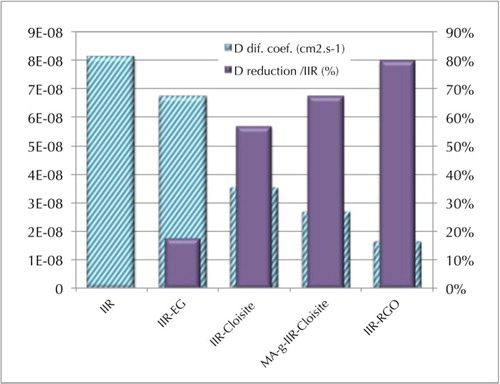
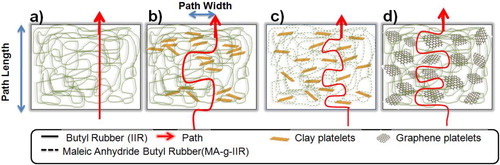
Figure 10. Schematic representation of tortuous path and dispersion in a IIR, b IIR-Cloisite10A, c MA-g-IIR-Cloisite10A, and d IIR-RGO nanocomposites