Figures & data
Fig. 1 Experimental Protocol

Table 1 Characteristics of the half-marathon runners in the BJ and PLA groups
Fig. 2 Change in CRP. Values are geometric means (GM) and the error bars represent ×/÷ SD of the GM [Citation35];* possibly harmful greater increase in CRP from pre-race to 48 h post-race ** likely harmful greater increase in CRP from pre-race to 24 h in BJ group relative to PLA group (BJ group n = 9; PLA group n = 10)
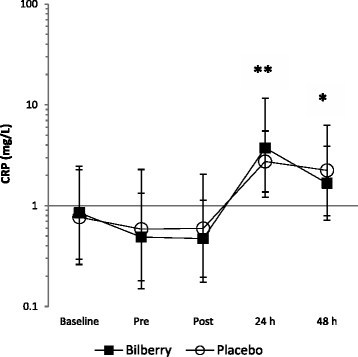
Fig. 3 Change in reported muscle soreness. Values are displayed as mean percentages and error bars are ±SD * possibly harmful greater increase in DOMS from pre-race to immediately post-race in BJ group relative to PLA (BJ group n = 9; PLA group n = 10)

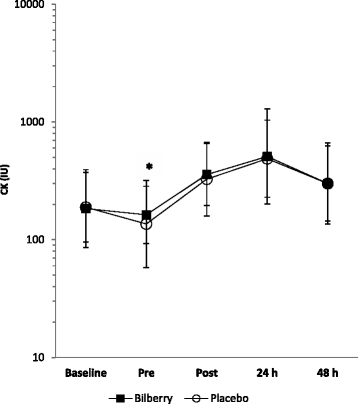
Fig. 4 Change in creatine kinase. Values are geometric means (GM). The error bars represent the ×/÷ SD of the GM [Citation35] * possibly harmful smaller decrease in CK from baseline to pre-race in BJ group relative to PLA (BJ group n = 9; PLA group n = 10)