Figures & data
Table 1 Basic characteristics of the study groups (mean ± standard deviation)
Table 2 Training schedules during the weeks preceding blood samples before (Trial I) and after (Trial II) the supplementation
Table 3 Changes in a 2000 m rowing ergometer performance before and after the supplementation
Fig. 1 Data represents the mean (SD) values for total antioxidant capacity (TAC) (a) and uric acid (UA) (b) levels during exercise tests performed before and after supplementation (mean ± SD). Note: TAC = total antioxidant capacity; UA = uric acid; ![]()
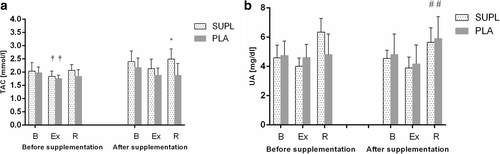
Fig. 2 Data represents the mean (SD) values for hepcidin (a), myoglobin (b) and iron (Fe) (c) levels during exercise tests performed before and after the supplementation (mean ± SD). Note: Fe = iron; ![]()
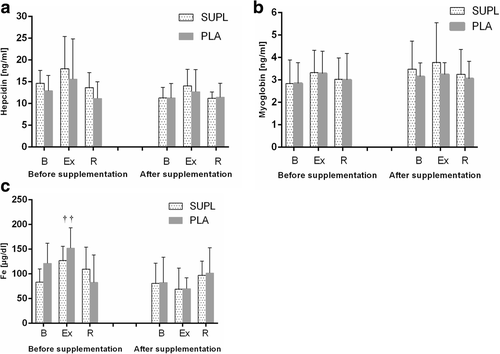
Fig. 3 Data represents the mean (SD) values for iron binding capacity (UIBC) (a), total iron binding capacity (TIBC) (b), ferritin (c) and soluble transferrin receptors (sTfR) (d) levels during exercise tests performed before and after the supplementation (mean ± SD). Note: UIBC = unsaturated iron binding capacity; TIBC = total iron binding capacity; sTfR = soluble transferrin receptors;![]()
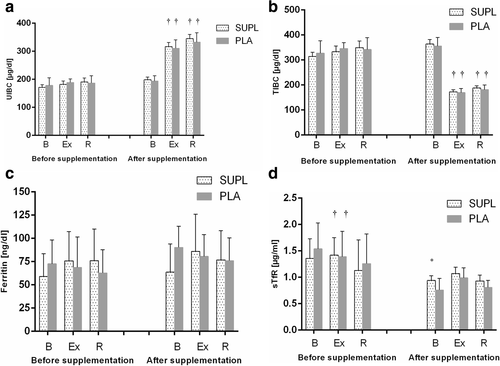
Fig. 4 Data represents the mean (SD) values for interleukin 6 (IL-6) levels during exercise tests performed before and after the supplementation (mean ± SD). Note: IL 6 = interleukin 6; ![]()
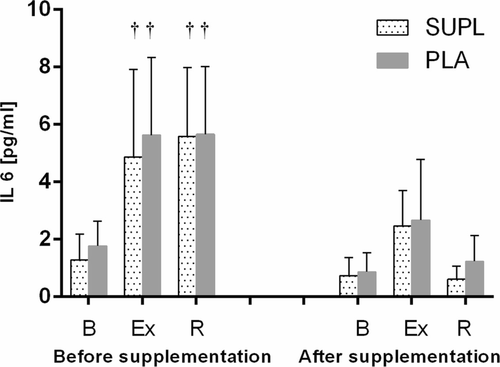
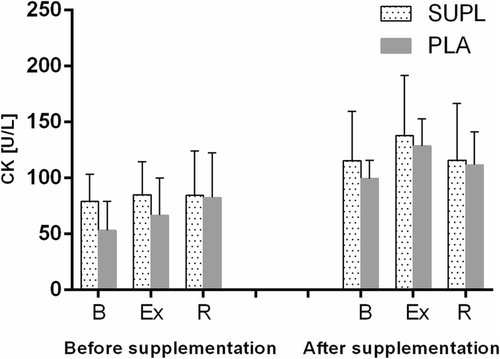
Fig. 5 Data represents the mean (SD) values for creatine kinase (CK) levels during exercise tests performed before and after the supplementation (mean ± SD). Note: CK = creatine kinase;![]()