
Figures & data
Fig. 1 Research Design Overview
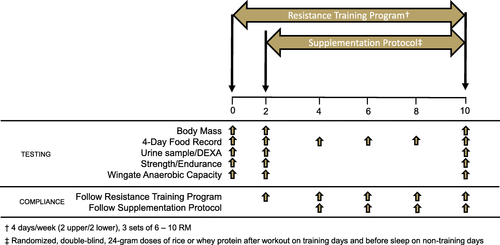
Table 1 Sample resistance training program
Table 2 Dietary Variables
Table 3 Amino Acid Composition
Fig. 2 CONSORT diagram
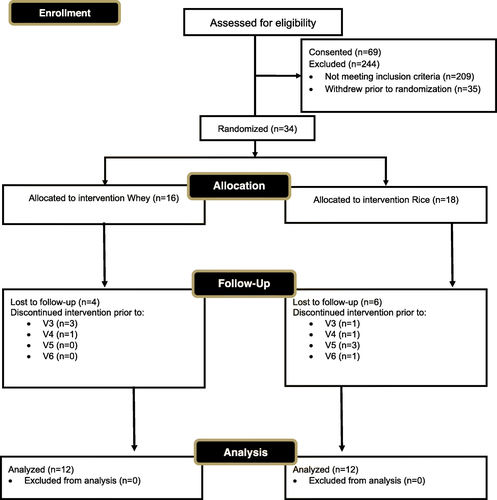
Table 4 Hemodynamic and Body Composition Variables
Fig. 3 (Sub-Panel a & b): DXA fat-free mass (in kilograms) in rice and whey protein supplemented groups. Panel a: Raw data (Rice = 0.05 ± 4.8% change; Whey = 1.5 ± 4.5% change); Panel b: Individual response data. All data is presented as means ± SD. * = Different from within-group week 0 value
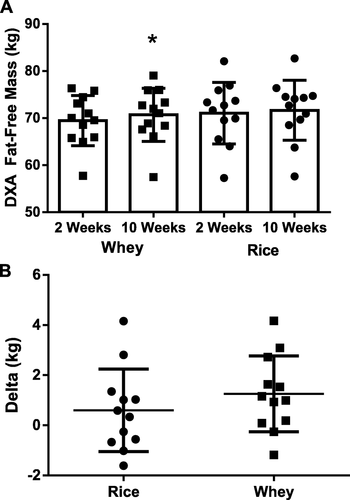
Table 5 Performance Variables
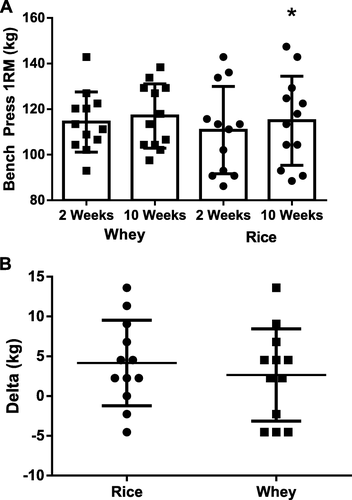
Fig. 4 (Sub-Panel a & b): Bench-press one-repetition maximum (1RM) in rice and whey protein supplemented groups. Panel a: Raw data (Rice = 3.9 ± 4.9% change; Whey = 2.4 ± 5.0% change); Panel b: Individual response data. All data is presented as means ± SD. * = Different from within-group week 0 value
Availability of data and materials
Please contact corresponding author for additional data. Only blinded, de-identified data may be provided upon request with an appropriate and substantiated justification for any such request.