Figures & data
Table 1. Currently used conditioning regimens in HCT centers performing large numbers of cord blood transplantation.
Figure 1. Schematic representation of fixed dosing (top row) and individualized dosing (bottom row). In fixed dosing, most variability is found in concentration/exposure and drug effects, leading to under- and overdosing in a part of the population. In individualized dosing, the variability is found in the dose, thereby accounting for differences in PK, leading to more on-target exposure and drug effects. Adapted with permission from: Steeghs N, Best Practice: TDM in oncology. Where there is evidence. Presented at the International Association for Therapeutic Drug Monitoring and Clinical Toxicology 2015 in Rotterdam, the Netherlands.
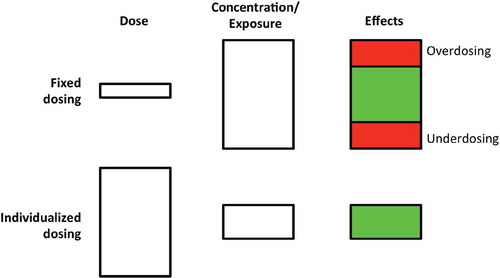
Figure 2. The development of individualized dosing. First, in the model-building phase, samples are collected from the population of interest. Next, the PK and PD are described in this population. In the clinical implementation phase, using the PD-model, the therapeutic window is determined. Knowing the target exposure, the optimal dosing is calculated using the PK-model. This optimal dosing is evaluated in prospective clinical trial, potentially leading to a validated individualized dosing regimen.
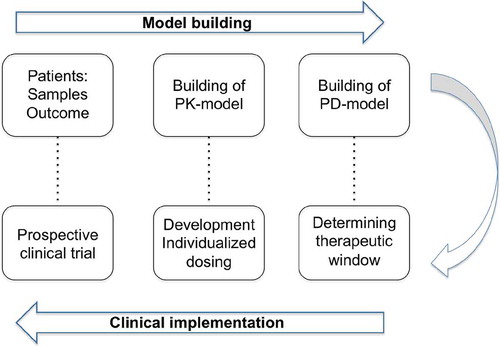
Figure 3. Weibull model of busulfan exposure in relation to EFS for all patients, showing the optimal exposure to be between 80-100 mg*h/L. Solid and dashed blue lines: Weibull model with 95% confidence intervals. Red dashed line: Kaplan Meier estimate. Reprinted from: Lalmohammed et al, Studying the Optimal Intravenous Busulfan Exposure in Pediatric Allogeneic Hematopoietic Cell Transplantation (alloHCT) to Improve Clinical Outcomes: A Multicenter Study, Biology of Blood and Marrow Transplantation 2015;21(2):S102-S103, with permission from Elsevier.
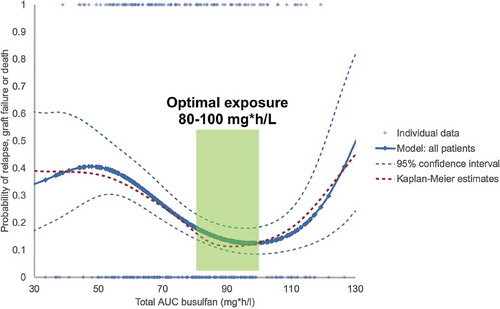
Figure 4. Chance of successful reconstitution, incidence of acute graft-versus-host disease, and overall survival (A) Successful CD4+ T-cell reconstitution before day 100, defined as twice > 50 x 106/L (red 0’s) and grade 2–4 acute GvHD (blue I’s) versus AUC of active ATG after HCT. The logistic regression lines show the chance of successful reconstitution versus the AUC after HCT (red line) and the chance of developing acute GvHD of at least grade 2 versus the AUC after HCT (blue line). Every I or O represents a patient with their respective AUC after HCT (x axis) and whether they had an event (y axis, either yes [1; top] or no [0; bottom]). Therefore, the patient with an AUC after HCT of 480 AU × day/mL had no immune reconstitution and no GvHD. (B) Kaplan-Meier survival curve of overall survival according to successful CD4+ T-cell immune reconstitution. Reprinted from: Lancet Haematology, Volume 2, Issue 5, Admiraal et al, Association between anti-thymocyte globulin exposure and CD4+ immune reconstitution in paediatric haemopoietic cell transplantation: a multicentre, retrospective pharmacodynamic cohort analysis, e194-e203. Copyright (2014), with permission from Elsevier.
![Figure 4. Chance of successful reconstitution, incidence of acute graft-versus-host disease, and overall survival (A) Successful CD4+ T-cell reconstitution before day 100, defined as twice > 50 x 106/L (red 0’s) and grade 2–4 acute GvHD (blue I’s) versus AUC of active ATG after HCT. The logistic regression lines show the chance of successful reconstitution versus the AUC after HCT (red line) and the chance of developing acute GvHD of at least grade 2 versus the AUC after HCT (blue line). Every I or O represents a patient with their respective AUC after HCT (x axis) and whether they had an event (y axis, either yes [1; top] or no [0; bottom]). Therefore, the patient with an AUC after HCT of 480 AU × day/mL had no immune reconstitution and no GvHD. (B) Kaplan-Meier survival curve of overall survival according to successful CD4+ T-cell immune reconstitution. Reprinted from: Lancet Haematology, Volume 2, Issue 5, Admiraal et al, Association between anti-thymocyte globulin exposure and CD4+ immune reconstitution in paediatric haemopoietic cell transplantation: a multicentre, retrospective pharmacodynamic cohort analysis, e194-e203. Copyright (2014), with permission from Elsevier.](/cms/asset/b282b63c-036e-4ff7-8384-32c1fef3c70e/iebt_a_1164688_f0004_oc.jpg)
Figure 5. CD4+ T-cell reconstitution and overall survival according to area under the curve after haemopoietic stem cell transplantation by stem cell source. The effect of AUC of ATG after HCT on immune reconstitution in all patients (A), those who received cord blood transplants (B) and those who received bone marrow and peripheral blood stem cell transplants (C). Reprinted from: Lancet Haematology, Volume 2, Issue 5, Admiraal et al, Association between anti-thymocyte globulin exposure and CD4+ immune reconstitution in paediatric haemopoietic cell transplantation: a multicentre, retrospective pharmacodynamic cohort analysis, e194-e203. Copyright (2014), with permission from Elsevier.
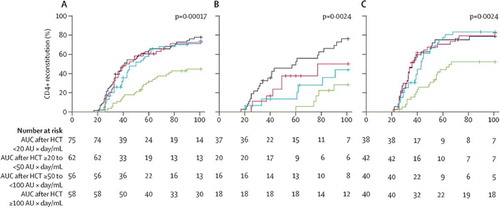
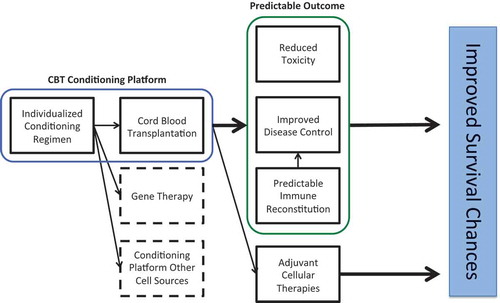
Figure 6. Summarizing figure showing the implications of individualized dosing in the conditioning of hematopoietic cell transplantation.