
Figures & data
Table 1. Fentanyl dose absorbed from an iontophoretic transdermal system Citation[2].
Table 2. Treatment sequences.
Table 3. Summary of subject enrollment and disposition.
Figure 1. Mean serum fentanyl concentration-time profiles after i.v. infusion or iontophoretic transdermal system treatments. (A) 23 – 48 h. (B) 23 – 25 h.
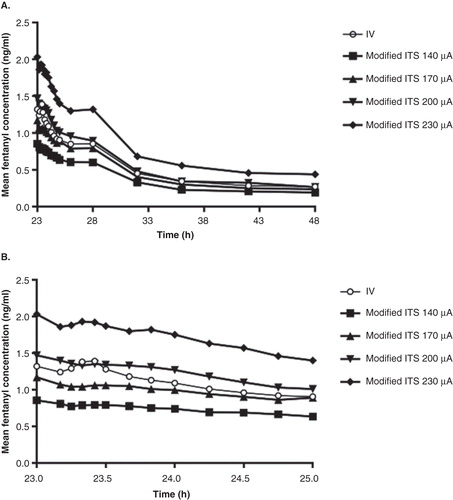
Figure 2. Comparison of mean (± standard deviation) fentanyl serum concentrations for the modified iontophoretic transdermal system at 170 μA (n = 41) and the i.v. infusion treatment (n = 43).
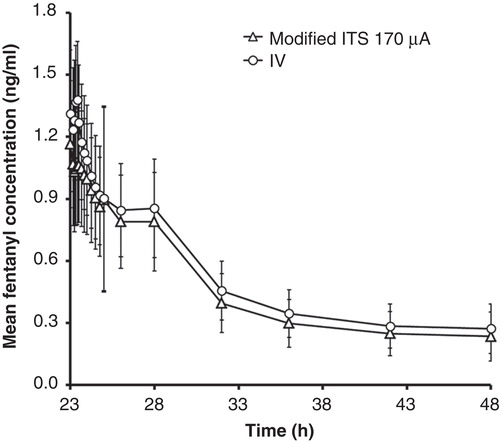
Table 4. Fentanyl pharmacokinetic parameters after intravenous infusion or modified iontophoretic transdermal system.
Figure 3. Box plot comparisons of AUC 23 – 24 after i.v. infusion or modified iontophoretic transdermal system administration of fentanyl by treatment group. Standard box plot is defined by the interquartile range (IQR) with upper (75%) and lower (25%) quartiles (the box). Whiskers indicate the 1.5 IQR (50% of the difference between the third and fourth quartiles). Outliers (outside of the 1.5 IQR) are designated by markers. The median is represented by a solid line.
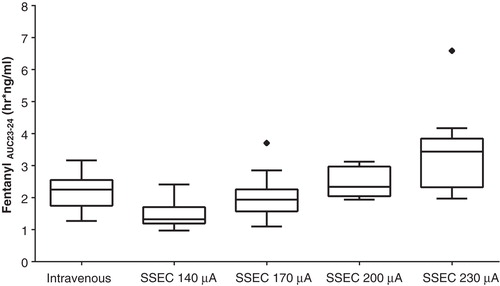
Figure 4. Mean dose absorbed (with standard deviations) from two consecutive doses using the modified iontophoretic transdermal system at various applied currents (line is a linear regression fit with r2 = 0.96), compared to dose absorbed from the original iontophoretic transdermal system at 170 μA (circle).
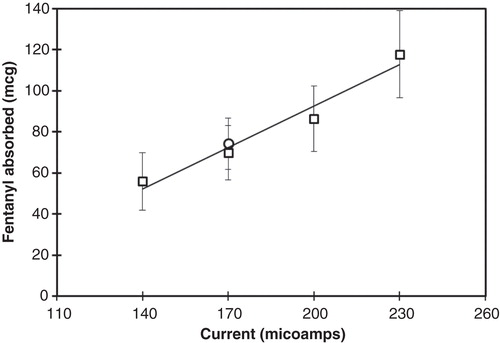
Table 5. Statistical comparison of fentanyl dose absorbed from the modified ITS (test, n = 40) and the original ITS (reference, n = 31) Citation[2].