Figures & data
Table 1. Activity cliff statistics.
Figure 1. Schematic activity cliff network. Exemplary clusters from the global AC network with irregular or recurrent main topologies and hybrids of these topologies are shown. In addition, for each topological category, the total number of clusters in the network is provided.
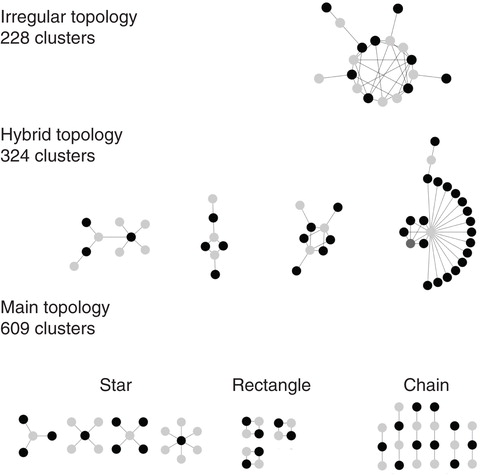
Figure 2. Activity cliff clusters in the index map. Activity cliffs depicted in Figure 1 have different locations in the index map depending on their individual cluster scores.
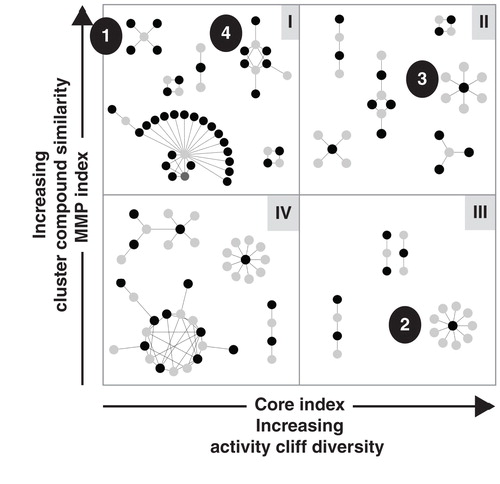
Figure 3. Index map-dependent differences in activity cliff cluster composition. Two representative activity cliff clusters with high MMP index (cluster 1; MMP index = 1.0) or Core index score (cluster 2; Core index = 0.75) are shown and compounds forming these clusters. Varying modification sites are highlighted using different shades of gray.
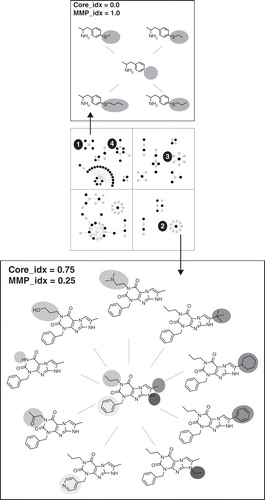
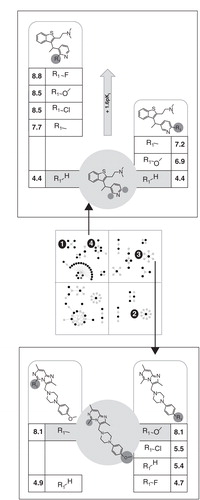
Figure 4. Activity class example. The index map distribution of activity cliff clusters formed by adenosine A3 receptor antagonists (ChEMBL target ID 256) is shown.
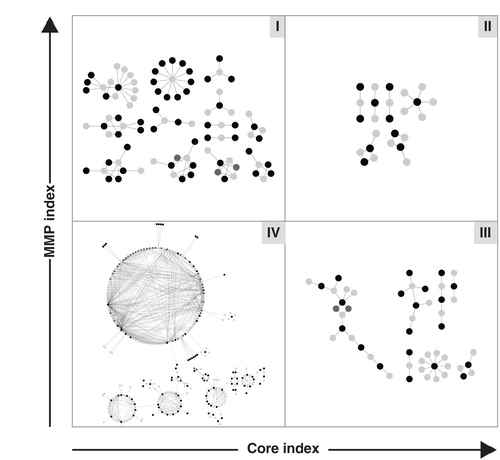
Figure 5. Matching molecular series from activity cliff clusters. Two exemplary pairs of MMS belonging to different relationship categories are depicted. For cluster 3 (MMS pair with no potency gain) and cluster 4 (MMS pair with a significant potency gain), the shared compound, MMP cores, and corresponding substitution sites are shown. For clarity, clusters and MMS of small size were selected for display. Modification sites are highlighted in gray.