Figures & data
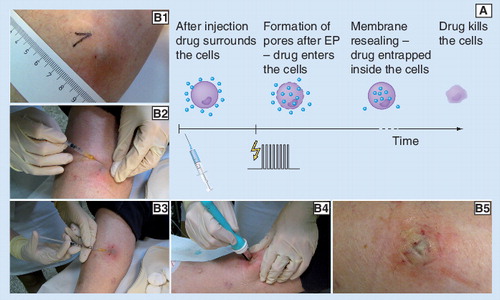
(A) The main mechanism of ECT and (B1–5) an example of a clinical ECT procedure are presented. In this example a subcutaneous melanoma metastasis on the lower leg was treated on an outpatient basis by ECT with cisplatin: (B1) tumor before treatment; (B2) application of local anesthesia; (B3) intratumoral injection of cisplatin; (B4) application of electric pulses using parallel plate electrodes; (B5) treated area immediately after treatment. Note the bluish-pale color of the treated area in the last photograph (indication of locally arrested tumor blood flow and the beginning of edema formation). For an example of the long-term effect of ECT on a bleeding melanoma tumor see .
EP: Electroporation.
(A) An example of rapid decrease in blood flow immediately after application of EP pulses. Movement artifacts caused by electric pulses and respiration can be seen in the unfiltered raw signal. (B–D) The effects of different treatments on blood flow over three different time frames. All data were measured in subcutaneous Sa-1 tumors in anesthetized A/J mice. OxyFlo laser Doppler flowmeter with bare fiber probes was used in A–C (Oxford Optronix, Oxford, UK) and PBV staining technique in D. For electrochemotherapy (ECT) bleomycin (1 mg/kg) was injected intravenously 3 min prior to application of EP. EP (eight pulses, amplitude 1040 V, duration 100 µs, 1 Hz, plate electrodes, 8 mm distance) was delivered at time 0. In B–D the data points represent the mean average blood flow and standard error of the mean (N ≥13 in figures B & C and N ≥3 in figure D). In figures B & C the values are expressed relatively as percentage of the pretreatment value.
EP: Electroporation.
Redrawn from Citation[66] in accordance with the ‘License to publish’ of British Journal of Cancer.
![Figure 2. Changes in tumor blood flow after different treatments.(A) An example of rapid decrease in blood flow immediately after application of EP pulses. Movement artifacts caused by electric pulses and respiration can be seen in the unfiltered raw signal. (B–D) The effects of different treatments on blood flow over three different time frames. All data were measured in subcutaneous Sa-1 tumors in anesthetized A/J mice. OxyFlo laser Doppler flowmeter with bare fiber probes was used in A–C (Oxford Optronix, Oxford, UK) and PBV staining technique in D. For electrochemotherapy (ECT) bleomycin (1 mg/kg) was injected intravenously 3 min prior to application of EP. EP (eight pulses, amplitude 1040 V, duration 100 µs, 1 Hz, plate electrodes, 8 mm distance) was delivered at time 0. In B–D the data points represent the mean average blood flow and standard error of the mean (N ≥13 in figures B & C and N ≥3 in figure D). In figures B & C the values are expressed relatively as percentage of the pretreatment value.EP: Electroporation.Redrawn from Citation[66] in accordance with the ‘License to publish’ of British Journal of Cancer.](/cms/asset/ff80c577-c8c5-484b-a0b8-29e244203687/iery_a_11219500_f0002_b.jpg)
The endothelial cell monolayer was exposed to three electric pulses (duration 100 µs, repetition frequency 1 Hz, amplitude 40 V, interelectrode distance 4 mm) in situ. Microtubules and actin filaments were stained with an anti-β-tubulin antibody and phalloidin respectively and analyzed by fluorescence microscopy. Before EP, cells displayed intact actin filament and microtubule networks. After application of EP, staining of actin fibers with phalloidin appeared diffused demonstrating dissociation of actin fibers, while microtubules became fragmented. Microtubule and microfilament networks recovered their structural composition within 1 h after exposure to electric pulses at amplitude of 40 V.
EP: Electroporation.
Reproduced with permission from Citation[86].
![Figure 3. The effect of EP on human umbilical vein endothelial cells.The endothelial cell monolayer was exposed to three electric pulses (duration 100 µs, repetition frequency 1 Hz, amplitude 40 V, interelectrode distance 4 mm) in situ. Microtubules and actin filaments were stained with an anti-β-tubulin antibody and phalloidin respectively and analyzed by fluorescence microscopy. Before EP, cells displayed intact actin filament and microtubule networks. After application of EP, staining of actin fibers with phalloidin appeared diffused demonstrating dissociation of actin fibers, while microtubules became fragmented. Microtubule and microfilament networks recovered their structural composition within 1 h after exposure to electric pulses at amplitude of 40 V.EP: Electroporation.Reproduced with permission from Citation[86].](/cms/asset/5f509d48-68e7-496f-9a9c-c64ebce264b0/iery_a_11219500_f0003_b.jpg)
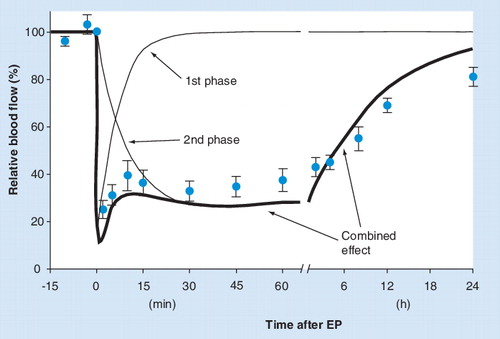
The total perfusion change (thicker line) observed in solid tumors after EP is modeled here as a sum of two simple biexponential functions with different time constants (thin lines). For comparison with experimental data, the data points for EP from are superimposed on the model. A more elaborate mathematical representation of the two components in the model would have to be used to fully describe the actual blood flow data, but the general adequacy of a two-phase model to describe the experimental data is obvious.
EP: Electroporation.
The results of the PBV-staining technique are shown. Symbols represent mean values of at least six mice with standard error of the mean. Time 0 corresponds to the pretreatment value. Bleomycin and cisplatin were injected 3 min prior to EP at doses 5 mg/kg and 4 mg/kg, respectively. EP protocol: eight pulses, amplitude 1040 V, duration 100 µs, 1 Hz, plate electrodes, interelectrode distance 8 mm.
ECT: Electrochemotherapy; EP: Electroporation.
Based on combined data from Citation[67,81,82].
![Figure 5. Electrochemotherapy with cisplatin and bleomycin: comparison of the effects on blood flow in tumors.The results of the PBV-staining technique are shown. Symbols represent mean values of at least six mice with standard error of the mean. Time 0 corresponds to the pretreatment value. Bleomycin and cisplatin were injected 3 min prior to EP at doses 5 mg/kg and 4 mg/kg, respectively. EP protocol: eight pulses, amplitude 1040 V, duration 100 µs, 1 Hz, plate electrodes, interelectrode distance 8 mm.ECT: Electrochemotherapy; EP: Electroporation.Based on combined data from Citation[67,81,82].](/cms/asset/a477a037-9ce9-4535-ad28-46f17a8ca91a/iery_a_11219500_f0005_b.jpg)
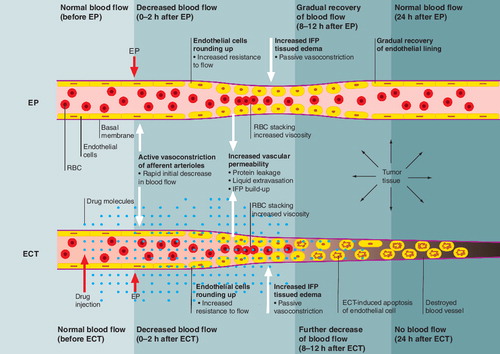
The effects of EP alone and of ECT are presented on the level of a microcirculatory blood vessel. Application of the drug and electric pulses are indicated by the block arrows. The general sequence of physiological changes and their consequences runs from the left to the right.
ECT: Electrochemotherapy; EP: Electroporation.
It can be observed that bleeding of this tumor was stopped immediately after the application of ECT. Gradually a crust was formed in place of the tumor (within 1 week), which fell off 3 weeks after the treatment. This particular tumor reduced in size dramatically and remained in partial response during the 21 weeks observation time.
ECT: Electrochemotherapy.
Reproduced with permission from Citation[100].
![Figure 7. The effect of electrochemotherapy (ECT) with bleomycin on bleeding melanoma metastasis.It can be observed that bleeding of this tumor was stopped immediately after the application of ECT. Gradually a crust was formed in place of the tumor (within 1 week), which fell off 3 weeks after the treatment. This particular tumor reduced in size dramatically and remained in partial response during the 21 weeks observation time.ECT: Electrochemotherapy.Reproduced with permission from Citation[100].](/cms/asset/483086f8-713a-4b89-a147-65b706af4058/iery_a_11219500_f0007_b.jpg)