Figures & data
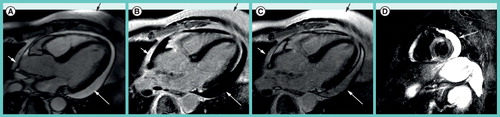
(A) Triple-inverted T2-weighted fast spin echo (short tau inversion recovery) reveals epicardial hyperintense edema in the apical-lateral and basal-lateral wall (white arrows). The bright signal in the apical lumen represents slow flow, but not edema (black arrow). (B) The fast low-angle shot gradient echo late gadolinium enhancement (LGE) image with phase-sensitive reconstruction delineates focal fibrosis in the same location (white arrows). (C) The diastolic steady state free precession cine frame illustrates the extent of the lateral wall and confirms the epicardial location of the myocarditis lesions. There is a small rim of pericardial fluid, hypointense in (A) and (B), hyperintense in (C). There is a focal hepatic lesion: (A) bright in T2 and (B) hypointense in LGE and (C) cine, most likely representing a liver cyst.
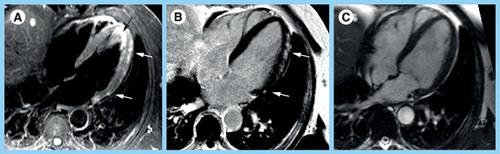
Both images are from an axial stack of images that are obtained in an interleaved fashion over minutes before and after contrast to reflect accumulation in the interstitial space. (B) Note the increased myocardial signal intensity in the postcontrast image reflecting global left ventricular inflammation. Global relative enhancement was 4. Skeletal muscle in the right and left lower corner of the images is available for comparison. The body coil was used for image acquisition. The oblique saturation bars were applied to reduce aortic and atrial flow artifacts.
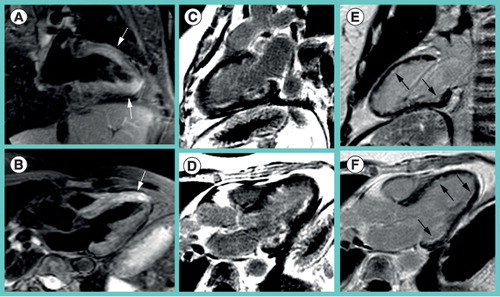
As it turned out afterwards, she had pulmonary infiltrates, eosinophilia, a history of sinusitis and asthma. Myocardial biopsy confirmed Churg–Strauss vasculitis. (A) T2-weighted images depict edema in the anterior and apical-inferior wall (arrow) as well as (B) anteroseptal wall (arrow). (C & E) Late gadolinium enhancementimages in the two-chamber-view and (D & F) three-chamber-view delineate subendocardial fibrotic lesions in the anterior, posterolateral and inferior wall. (E & F) Follow-up after 1 year revealed fibrotic lesions that persisted but had shrinked in size (arrows).
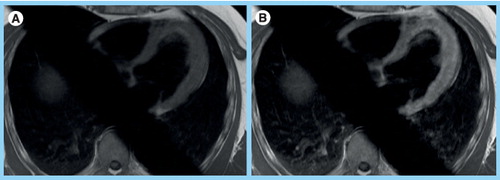
(A) On steady state free precession cine images, pericardial fluid (white arrows) appears slightly brighter than fat (black arrow). (B) On the late gadolinium enhancement (LGE) phase-sensitive inversion-recovery image the effusion (white arrow) appears hypointense, while pericardial and subcutaneous fat (black arrow) appear bright. (C) On magnitude LGE images the effusion (white arrow) has intermediate signal intensity less bright than fat (black arrow). (D) The triple-inverted fast spin echo (short tau inversion recovery) image highlights bright pericardial fluid (white arrow), but also the fluid-filled stomach, the spleen and the kidney.