Figures & data
FIGURE 1. Map of Greenland showing the location of the Mittivakkat Glacier, the hydrometric station described in Hasholt and Mernild (Citation2006), and the catchment watershed divide after Mernild et al. (Citation2008) (modified after Greenland Tourism).
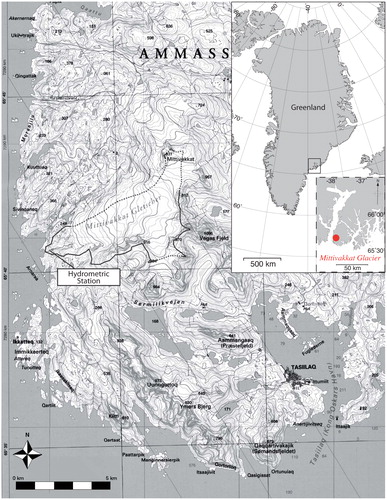
FIGURE 2. Schematic diagram of supraglacial, englacial, and subglacial drainage passageways. The figure is modified from Röthlisberger and Lang (Citation1987) to sketch the conceptual elements of the model by Clarke (Citation1996b). The circuit numbers 0, 1, 2, 3 denote places where the hydraulic head, water discharge, and suspended sediment concentrations are evaluated.
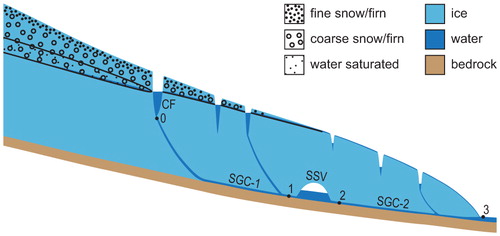
TABLE 1 Physical constants for the Mittivakkat glacier setup.
TABLE 2 Parameters used in the sediment model for the Mittivakkat glacier. The parameters are slightly modified from Clarke (Citation1996b) (following the descriptions in Mernild [Citation2006] and Mernild et al. [Citation2006]) to fit the Mittivakkat glacier.
FIGURE 3. Suspended sediment concentration (SSC) from the sediment model using four different values of kE ().
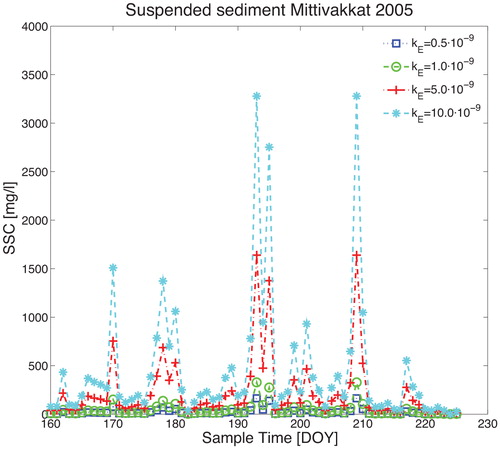
FIGURE 4. Suspended sediment concentration (SSC) from the sediment model using four different values of N ().
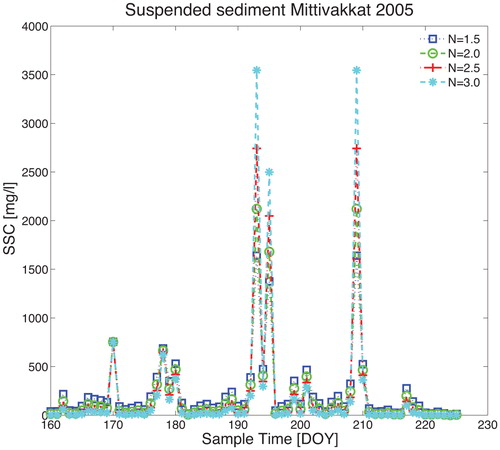
FIGURE 5. Suspended sediment concentration (SSC) from the sediment model using four different values of Dp ().
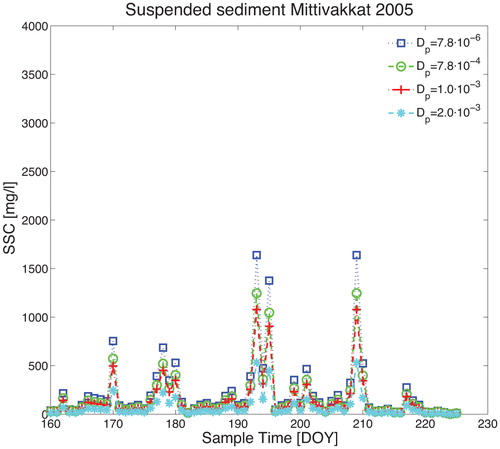
FIGURE 6. Suspended sediment concentration (SSC) from the sediment model using four different cross sections of the lower conduit system ().
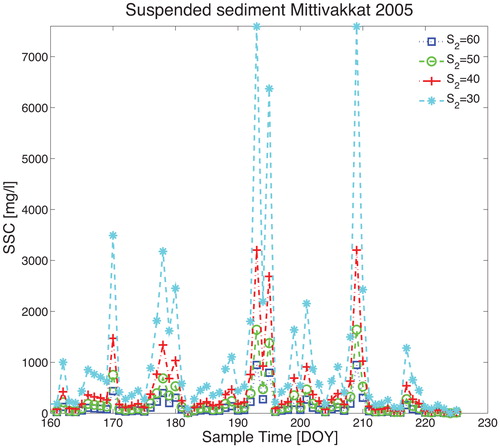
FIGURE 7. (A) Snowpack (SMP) from SnowModel and observations. Curve connecting asterisks is the calculated mean daily value of the observations. (B) Suspended sediment concentration (SSC) from the sediment model and observations.
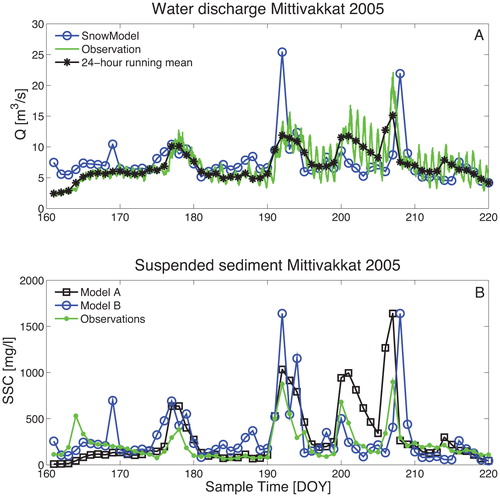
TABLE 3 Correlation coefficients for the model setup given in Tables 1 and 2 compared to observed mean daily (Model A) and mean daily SnowModel values (Model B).
FIGURE 8. (A) Cumulative SMP from SnowModel and observations, and (B) cumulative suspended sediment transport (SST) from the sediment model and observations.
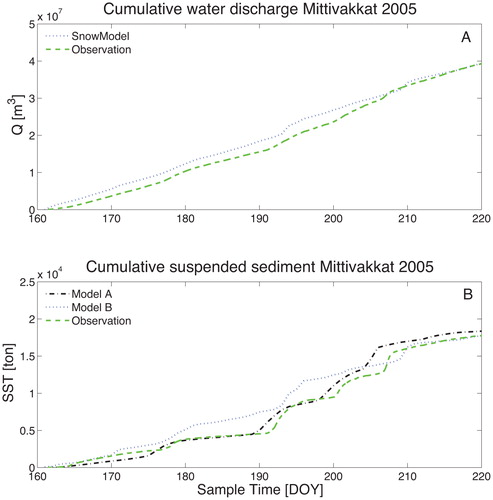
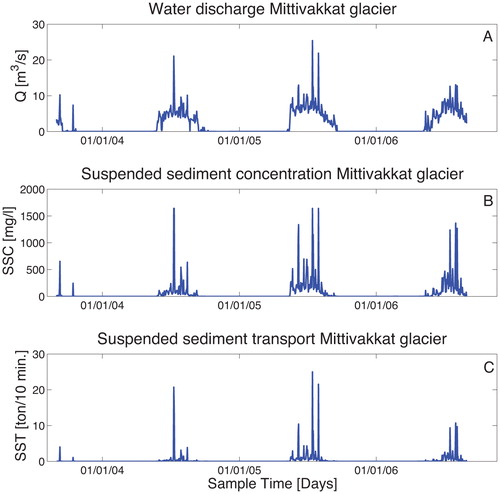
FIGURE 9. (A) Water discharge (Q) calculated from the SnowModel. (B) Suspended sediment concentration (SSC) calculated from the sediment model. (C) Suspended sediment transport (SST) calculated from the sediment model.