Figures & data
FIGURE 1. Maps of the (A) Innoko, Alaska, study area and the (B) Abisko, Sweden, and Norway/Finland Border Fence study areas.
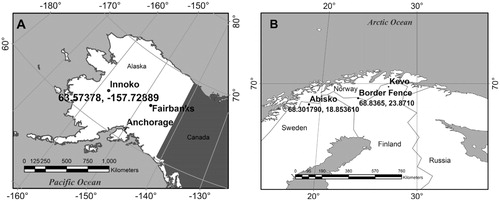
FIGURE 2. Radiometric surface temperature (Tsurf ) of representative Sphagnum fuscum, Cladonia rangiferina, and Pleurozium schreberi patches in the Innoko National Wildlife Refuge, Alaska.
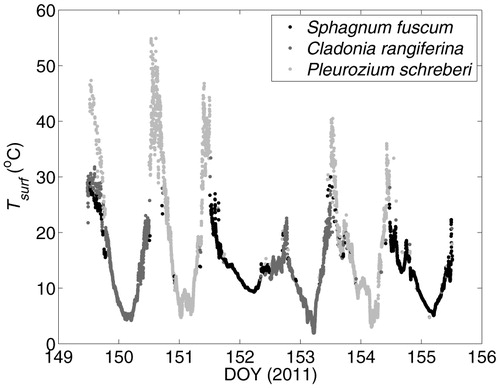
FIGURE 3. Temperature at 1 cm (T1 cm , A) and 5 cm (T5cm, B) below the surface of Sphagnum fuscum, Cladonia rangiferina, and Pleurozium schreberi patches in the Innoko National Wildlife Refuge, Alaska. Subplot C represents the difference between subplots A and B.
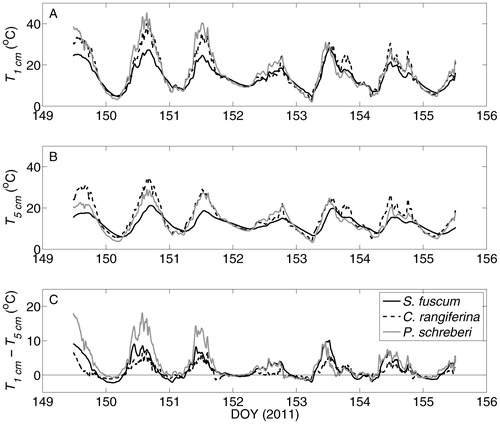
FIGURE 4. Estimated subsurface heat flux (G) in representative (A) Sphagnum fuscum, (B) Cladonia rangiferina, and (C) Pleurozium schreberi patches in the Innoko National Wildlife Refuge, Alaska. The line widths reflect uncertainty in thermal conductivity (k), which were taken to represent a range of published values (O'Donnell et al., 2009). Positive values reflect energy flux from surface to subsurface.
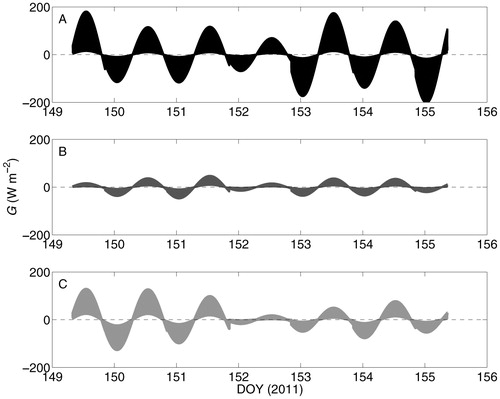
TABLE 1 Modeled damping depth (m) using Equation (3) as a function of day of year (2011) for the Sphagnum fuscum, Cladonia rangiferina, and Pleurozium schreberi study sites at Innoko, Alaska.
FIGURE 5. The mean and standard deviation of the spectral reflectance of four plots of Sphagnum fuscum, three plots of Polytrichum piliferum, two representative patches of bare ground, and a patch of saturated bare ground in a tundra ecosystem near Abisko, Sweden.
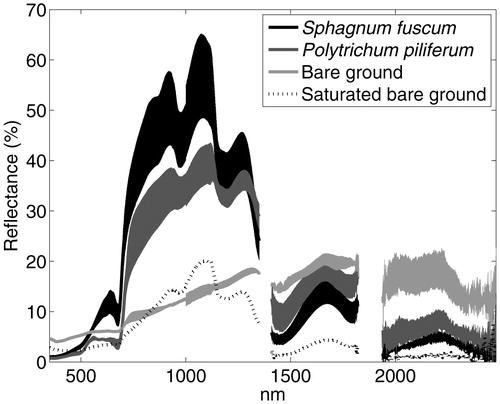
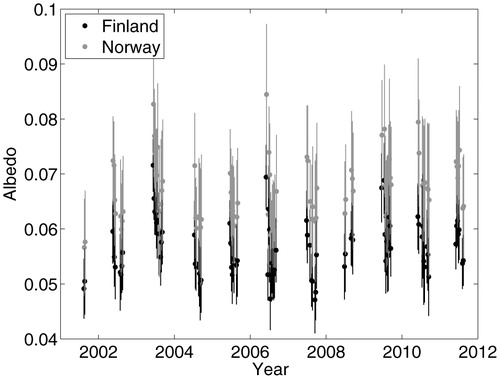
FIGURE 6. The mean and standard deviation of shortwave albedo calculated from the MODIS MCD34A1 product following Schaaf et al. (Citation2002) for Finnish and Norwegian sides of a Cladonia disturbance gradient along a border fence.