Figures & data
FIGURE 1. Photosynthetic rate per unit area (Aarea ) at 2000 µmol m-2 s-1 photosynthetic photon flux density for current-year and one-year-old needles from the wind-exposed site (▪) and the windprotected site (□). The measurements were conducted in the laboratory (see text). Means and SDs are shown (n = 4 for currentyear needles, and n = 6 for one-year-old needles). The P-values are the statistical significance based on generalized linear model (GLM) analysis. Data for the current-year needles are derived from Nagano et al. (Citation2009).
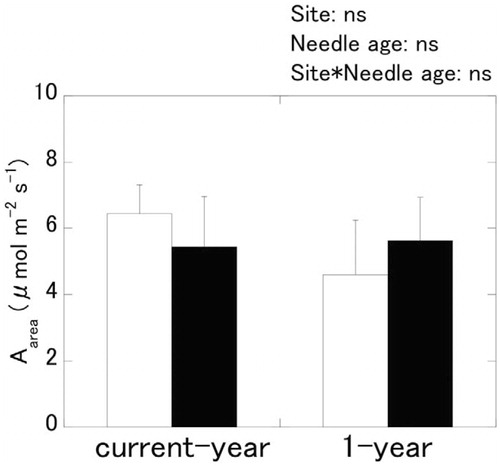
TABLE 1 Characteristics of current-year needles in September (partially excerpted from CitationNagano et al., 2009) and 1-year needles in July at the windexposed site and the wind-protected site. Abbreviations are as follows: Amass , photosynthetic rate at 2000 µmol m-2 s-1 photosynthetic photon flux density (PPFD) per unit mass; gs , stomatal conductance at 2000 µmol m-2 s-1 PPFD; Ci , intercellular CO2 concentration; A/PPFD, apparent quantum yield; IS, carboxylation efficiency; PNUE, photosynthetic nitrogen use efficiency; Narea , nitrogen content per unit area; Nmass , nitrogen content per unit mass; NMA, needle mass per unit area. Means with SD in parentheses are shown (n = 10 for Narea, Nmass and NMA for current-year needles; n = 4 for other characteristics of current-year needles; and n = 6 for all characteristics of one-year needles). Values were analyzed using a two-by-two factorial design for the site (wind-exposed and wind-protected) and needle age (current-year and one-year-old) to evaluate the interactive effects. Results of generalized linear model (F-value) performed to assess the effect of sites and needle age and their significance are also shown. Significant levels: ***, P < 0.001; **, P < 0.01; *, P < 0.05; +, P < 0.10; ns, P > 0.10.
FIGURE 2. Temporal changes of (a) photosynthetic photon flux density (PPFD); (b) air temperature (T); (c) vapor pressure (VP); (d) vapor pressure deficit (VPD); and (e) soil volume water content (SWC) in the field. Data were obtained at the wind-exposed site (dotted line) and at the wind-protected site (solid line), although PPFD was measured at an intermediate point between the two sites. For SWC (e), ML2 probe data for WE1 and WE2 at the wind-exposed site are indicated by a dotted line and a dashed line, respectively. The open circles represent the soil core samples from the wind-exposed site. The bold solid line represents WP of the ML2 probe at the windprotected site, whereas the solid circles represent the soil core samples at the wind-protected site.
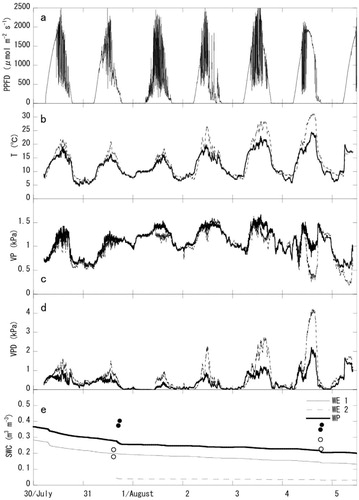
FIGURE 3. Diurnal changes in the (a) net photosynthetic rate per area (in situ Aarea
); (b) stomatal conductance (gs
); (c) intercellular CO2 concentration (Ci
); (d) quantum photochemical yield (ΔF/F in the daytime and Fv/Fm in the nighttime); and (e) xylem pressure potential (XPP) for one-year-old needles of P. pumila at the wind-exposed site (![]()
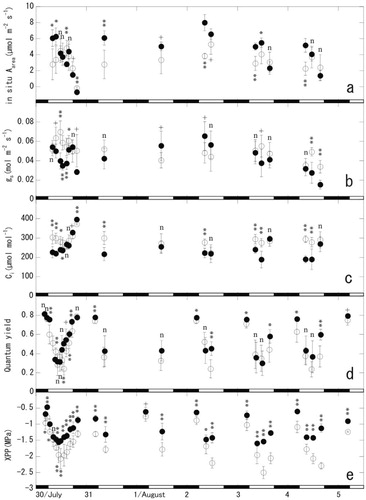
FIGURE 4. Relationships between (a) the net photosynthetic rate per area in the field (in situ Aarea
) and the xylem pressure potential (XPP); (b) the in situ Aarea
and electron transport rates (ETR); and (c) the in situ Aarea and stomatal conductance (gs
) of one-year-old needles at the wind-exposed site (![]()
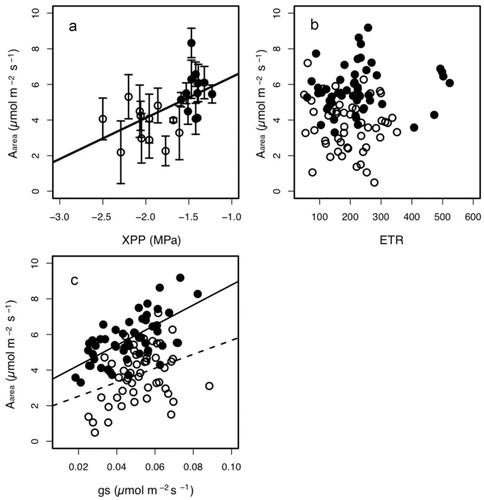
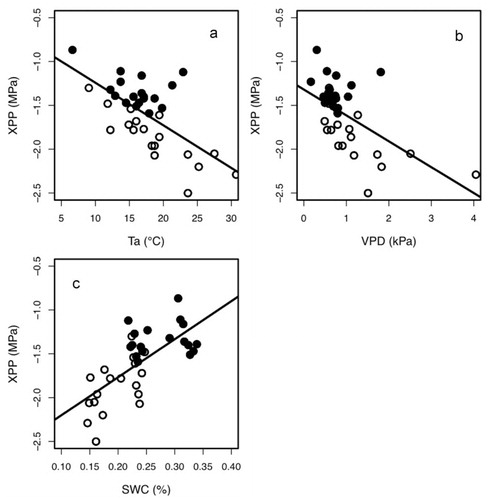
FIGURE 5. Relationships between (a) the xylem pressure potential (XPP) and air temperature (Ta
); (b) XPP and vapor pressure deficit (VPD); and (c) XPP and soil water content (SWC) at the wind-exposed site (![]()