Figures & data
Figure 1. (A) Photograph of one original sample placed in 4.7 cm2 CO2 inert small plastic bowls while maintaining their natural arrangement. (B) Close-up of the same sample. The measured biological soil crust (BSC) is a conglomerate of several lichen thalli [Lecanora expectans Darb. and Caloplaca darbishirei (Hoffm.) Th. Fr.]. (C) False color chlorophyll fluorescence images of the effective quantum yield (Y) of photosystem II distribution over three 4.7 cm2 samples from continental Antarctica (Site Garwood), obtained using an Imaging Pulse Amplitude Modulated Fluorometer (PAM) (Walz GmbH, Effeltrich, Germany). Yield intensity is color coded covering a range from 0.0–1, with red indicating very low values and violet high values. Each column represents one individual sample. First row: a typical day without activity; second row: a typical activity pattern after short snowfall event; third row: activity pattern during the melting event after three days of continuous snow fall. Red flags indicate Yield values at a chosen area of interest in the picture. Dates are given as dd.mm.yyyy.
![Figure 1. (A) Photograph of one original sample placed in 4.7 cm2 CO2 inert small plastic bowls while maintaining their natural arrangement. (B) Close-up of the same sample. The measured biological soil crust (BSC) is a conglomerate of several lichen thalli [Lecanora expectans Darb. and Caloplaca darbishirei (Hoffm.) Th. Fr.]. (C) False color chlorophyll fluorescence images of the effective quantum yield (Y) of photosystem II distribution over three 4.7 cm2 samples from continental Antarctica (Site Garwood), obtained using an Imaging Pulse Amplitude Modulated Fluorometer (PAM) (Walz GmbH, Effeltrich, Germany). Yield intensity is color coded covering a range from 0.0–1, with red indicating very low values and violet high values. Each column represents one individual sample. First row: a typical day without activity; second row: a typical activity pattern after short snowfall event; third row: activity pattern during the melting event after three days of continuous snow fall. Red flags indicate Yield values at a chosen area of interest in the picture. Dates are given as dd.mm.yyyy.](/cms/asset/95764991-31e4-4922-a22b-f6ce7b0bd77f/uaar_a_11957910_f0001.jpg)
TABLE 1 Comparison of the water sources used for thallus reactivation in situ. Given are the numbers of reactivation events, the total measuring period, and the total days with activity (plus the percentage of the days with activity per total measuring period).
FIGURE 2. Net CO2-exchange (positive values), dark respiration (negative values, upper panel) and corresponding microclimatic conditions (temperature, solar radiation and relative Humidity, second, third, and lower panels, respectively) from Antarctic BSCs (Site Garwood). Measured from 14.12.2009 until 18.01.2010 with 8 days without gas-exchange measurements between 02.01.2010 and 08.01.2010 (measuring break is indicated with a dark bar). CO2 exchange (net and dark respiration) is expressed on a surface area basis. Gray bar highlight snow events. Vertical lines delineate the weeks.
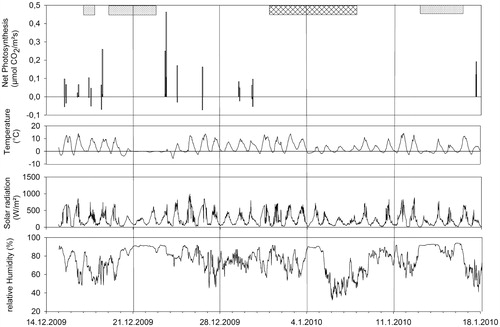
FIGURE 3. Net photosynthesis and respiration (upper row) with corresponding microclimatic conditions (temperature, photosynthetic active radiation (PAR), and water content of the sample, second, third, and bottom rows, respectively) of alpine BSCs (Site Hochtor). Measured from 25.07.2012 until 03.08.2012. CO2-exchange is expressed on a surface area basis. Gray bars delineate rain events, and vertical lines separate individual days.
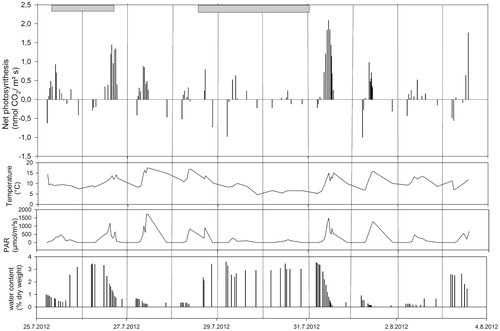
FIGURE 4. The response of net photosynthesis (vertical axis) to thallus water content (horizontal axis) for BSC from Site Hochtor; all data points from in situ CO2 exchange measurements are plotted.
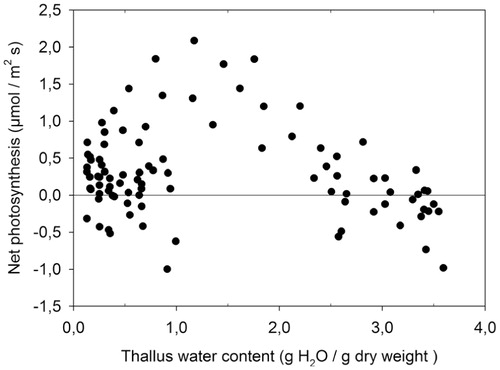
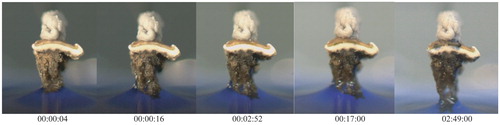
FIGURE 5. Water uptake over the rhizines of Psora decipiens. Time after first immersion into ink water is indicated underneath each picture (hh:mm:ss).