Figures & data
FIGURE 1. Study areas: Divide Mountain and White Calf Mountain on the Blackfeet Reservation and Glacier National Park, and Line Creek Research Natural Area in the Custer National Forest on the Beartooth Plateau in Montana. Map modified from Smith-McKenna et al. (Citation2013). White Calf is adjacent to and 2.5 km south of Divide Mountain.
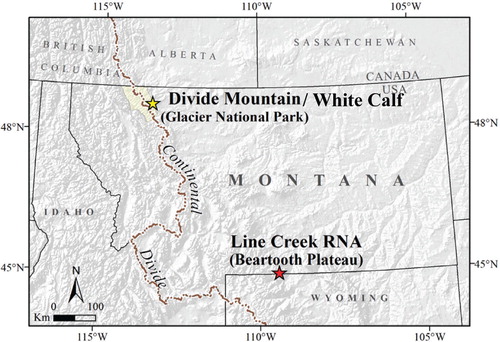
FIGURE 2. Daily maximum air temperatures from the northeast slopes of Divide Mountain (DM) and Line Creek (LC) in 2012, which is representative of study results. Day 1 represents 4 July at Divide Mountain and 17 July at Line Creek. WB = Pinus albicaulis, ES = Picea engelmannii, RK = rock, and UN = unprotected (exposed) microsites.
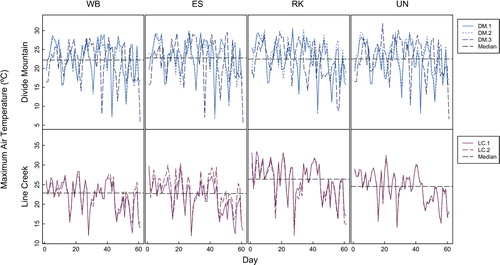
TABLE 1 Median and range (minimum, maximum) of values for microclimate variables measured during 2010–2012 for each microsite type. (Values measured in 2010 from the west-facing aspect not included.) % diff = percent of Kruskal-Wallis One-way ANOVA comparisons among microsite blocks that were statistically different (Divide Mountain, n = 7 comparisons; Line Creek, n = 5 comparisons). WB = Pinus albicaulis, ES = Picea engelmannii, RK = rock, UN = unprotected (exposed).
FIGURE 3. (A) Top, daily maximum soil temperatures from the northeast slopes of Divide Mountain (DM) and Line Creek (LC) in 2011. Day 1 represents 9 July at Divide Mountain and 22 July at Line Creek. (B) Bottom, daily maximum soil temperatures from the northeast slopes of Divide Mountain and Line Creek in 2012. Day 1 represents 4 July at Divide Mountain and 17 July at Line Creek. Abbreviations as in .
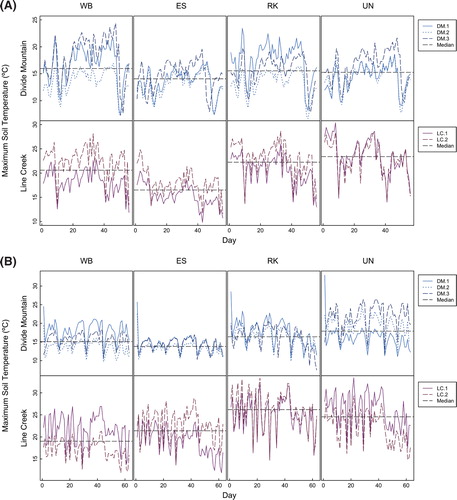
FIGURE 4. Daily photosynthetically active radiation (PAR), recorded only in 2010 on northeast- and west-facing slopes of Divide Mountain (DM) and Line Creek (LC). Day 1 represents 8 July at Divide Mountain and 22 July at Line Creek. Abbreviations as in .
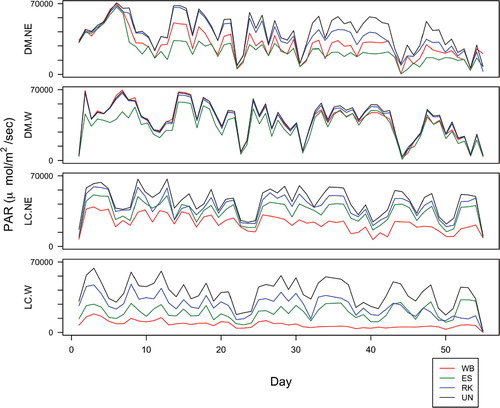
TABLE 2 Descriptive statistics for percent sky exposure for each microsite type associated with microclimate weather stations at Divide Mountain and Line Creek, and at randomly selected locations at White Calf. WB = Pinus albicaulis, ES = Picea engelmannii, SF = Abies lasiocarpa.
TABLE 3 Descriptive statistics for percent total nitrogen and carbon in soils sampled at Divide Mountain and Line Creek in 2011 and at randomly selected locations at White Calf in 2014. WB = Pinus albicaulis, ES = Picea engelmannii, SF = Abies lasiocarpa, Exposed = open.
TABLE 4 Comparisons of northeastern slope microclimate and overall average percent soil carbon and nitrogen between the Divide Mountain study area and Line Creek study area. These comparisons are based on data from unprotected (exposed) microsites. Microclimate data were collected from about mid-July though about mid-September in both study areas.
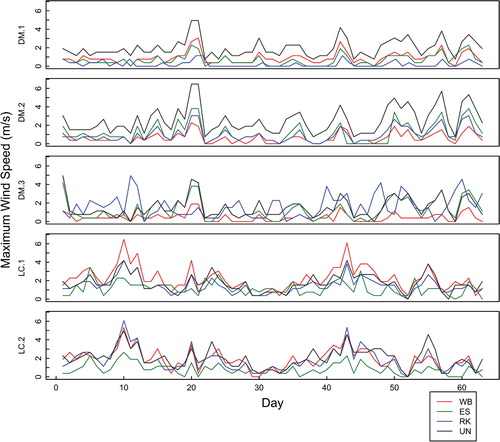
FIGURE 5. Wind speeds 10 cm above the ground from microsites on the northeast slope of Divide Mountain (DM) and Line Creek (LC) for the 2012 growing season. Abbreviations as in .