Figures & data
FIGURE 1. Overview of the investigated area and the Sisimiut glaciers. The two nearby towns are indicated with orange dots, and Aqqutikitsoq glacier is highlighted in yellow.
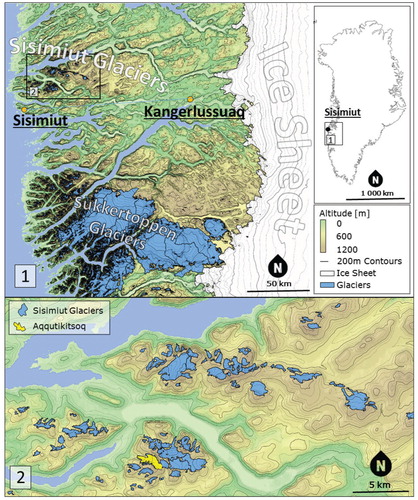
FIGURE 2. 1985 orthophoto. The area south of the dashed line is snow covered and resulted in low digital elevation model (DEM) quality. Colored dots indicate the points at which 1985 surface elevation was manually measured. The points' colors indicate their relative deviations from their neighbors within a 100 m diameter. Coordinates refer to Universal Transverse Mercator (UTM) zone 22N.
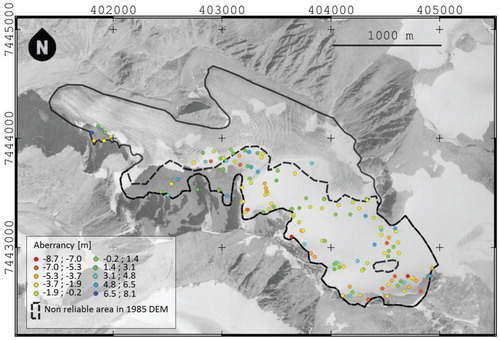
FIGURE 3. Orthophoto from August 2014 obtained by the Structure from Motion (SfM) process, camera positions and ground control points (GCPs). As the 2014 orthophoto is limited to the surroundings of the glacier and its immediate surroundings, it is superimposed on the 1985 orthophoto (monochromatic) to illustrate the estimated extent of the glacier at the end of the Little Ice Age. Coordinates refer to UTM zone 22N.
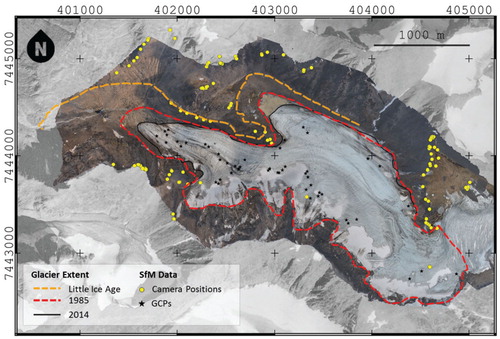
FIGURE 4. 1985 (left) and 2014 (right) DEMs with 25 m contour lines as well as the respective glacier outlines. Magnified sections of the DEMs are shown to highlight the difference in resolution and accuracy between the two models.
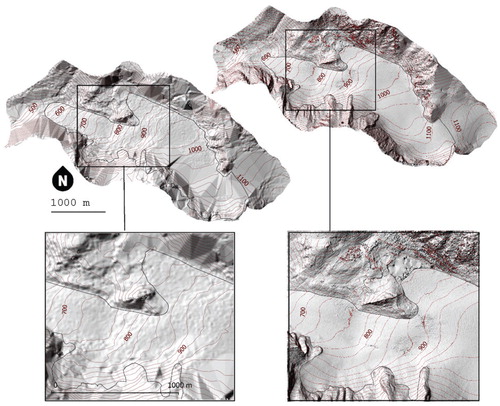
TABLE 1 DEM accuracy assessment: registration and validation errors and related variance for different numbers of ground control points (GCPs).
FIGURE 5. Registration and validation errors as functions of the number of the GCPs. Error bars represent residuals' variance. Note that the glacier surface area covered by the GCPs is proportional to their number. While the registration error does not depend on the number of GCPs, the validation error and its standard deviation decrease with an increasing number of GCPs. At eight GCPs the validation and registration errors become very similar.
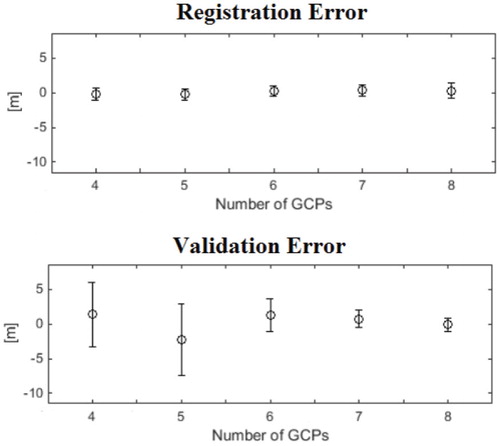
FIGURE 6. Average deviation of surface lowering (1985 to 2014) at the manually selected points, expressed as a function of horizontal distance. For a neighborhood distance of 100 m, the deviation is minimal, that is, 8.4 m. On average, we find 4.5 neighboring points within 100 m.
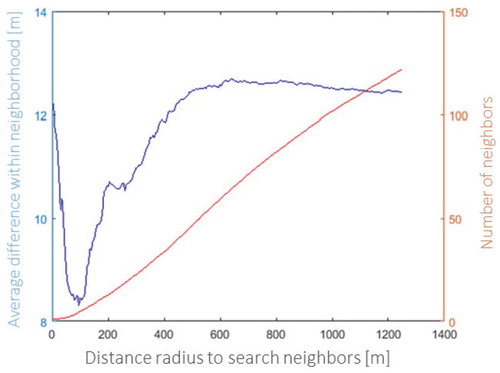
FIGURE 7. Ice thickness loss (m) of Aqqutikitsoq glacier from 1985 to 2014 using the difference of DEMs in the 1985 ablation area and universal kriging in the 1985 accumulation area. Coordinates refer to UTM zone 22N.
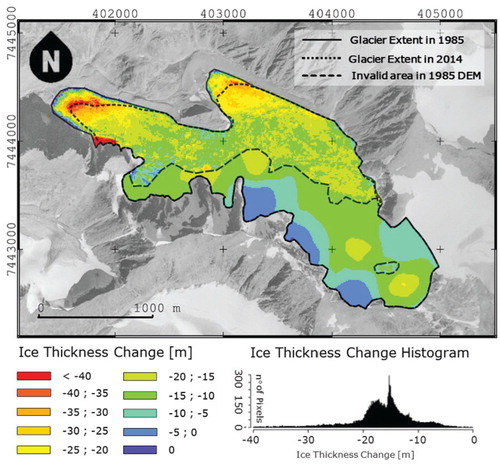
FIGURE 8. Location of ground penetrating radar (GPR) profiles and ice thickness distribution, August 2014. Coordinates refer to UTM zone 22N.
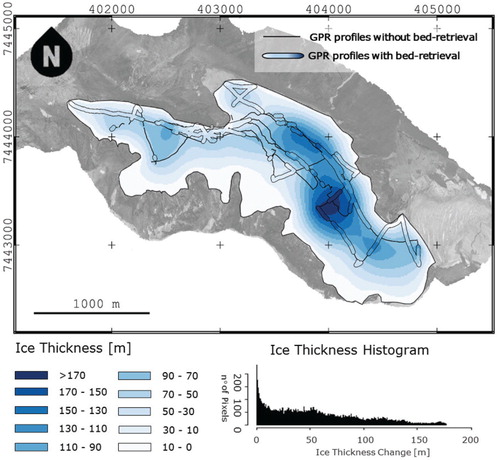
TABLE 2 Volumes and uncertainty calculation for ice thickness in 2014 and volume change between 1985 and 2014.
TABLE 3 Length, area, volume, and ice thickness of Aqqutikitsoq glacier in 1985 and 2014, as well as absolute and relative changes in the aforementioned parameters.
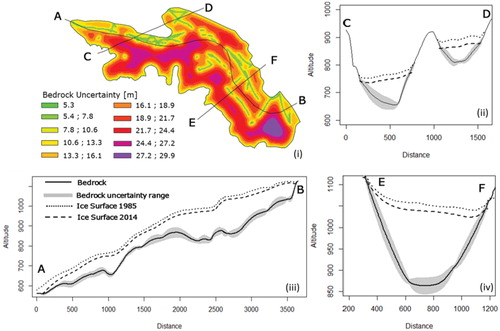
FIGURE 9. Uncertainty in the bedrock reconstruction given by the ordinary kriging approach (plot 1 in upper left). Three transects are shown (plots 2, 3, and 4) and vertically exaggerated by a factor 3 to visualize the surface lowering of the glacier surface and the uncertainty in bedrock interpolation.